1. Tideways Overview
Hi there!
Welcome to this Tideways Academy video course.
This first video will give you an overview about Tideways and what it can do to help with your web applications performance.
The other videos in this course will dive into the detail of individual parts of Tideways and you don’t necessarily have to view them in order.
There are three essential features in Tideways that help you understand the perforance of your application:
Let’s look at them one at a time and how they integrate with each other.
Monitoring
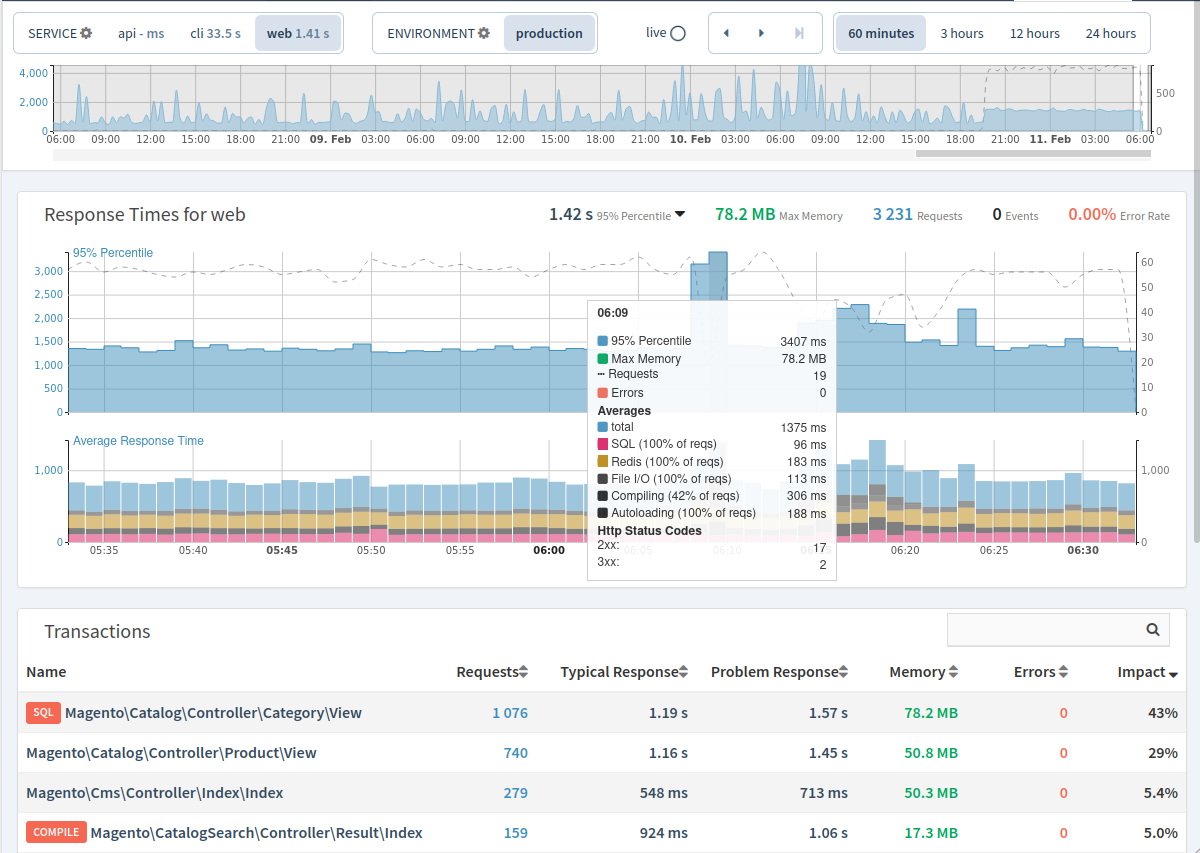
Let’s start with monitoring. The monitoring section in Tideways is where you get a high-level overview of your application, including:
What parts of the application have the biggest performance impact, grouped by
-
layers such as SQL databases, HTTP, Redis as shown in this tooltip or by
-
endpoints automatically detected from Tideways knowing about the most common PHP frameworks such as Magento, Symfony, Shopware or Laravel.
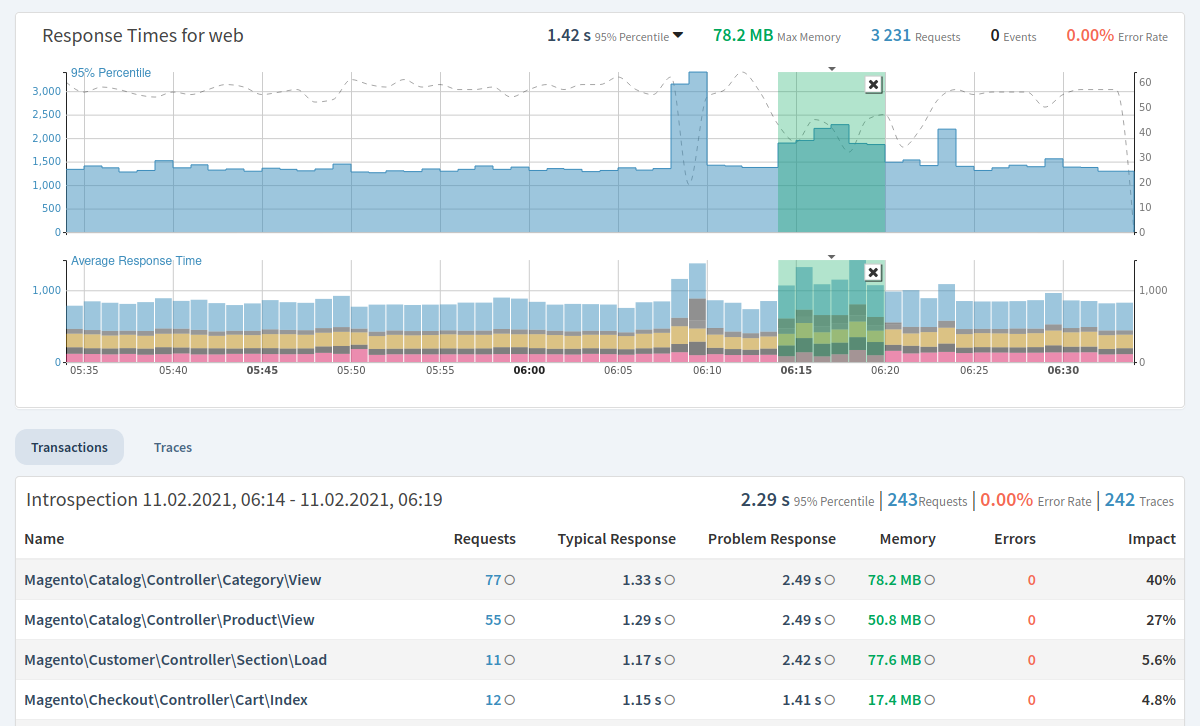
How long any sudden performance decrease lasted and what caused it, by allowing quick travel through time and by looking at selected performance snapshots.
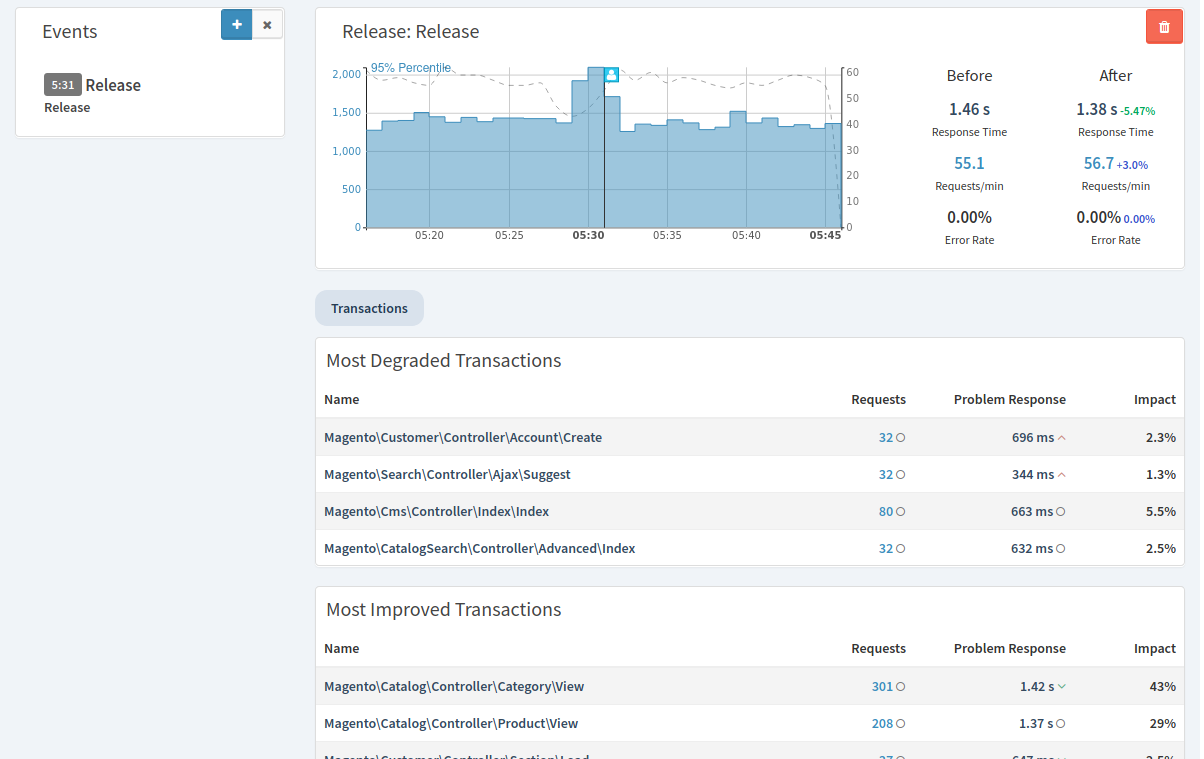
If a deployment caused a degredation in performance and which endpoints slowed down the most.
How many requests the application served what share of them resulted in a failure instead of a successful interaction, broken down to the individual HTTP error codes.
In short, you’re able to gauge the health of your application rapidly and know if and where something is going wrong.
Profiling
Profiling provides you with duration and memory usage of individual functions, database queries, and calls to external services. Armed with this level of detail you are enabled to dig deeper into your project so that you can reproduce and fix its performance bottlenecks.
Using a Profiler replaces intuition and educated guesses with facts and usually saves a lot of time.
Tideways supports two profiler types, these are:
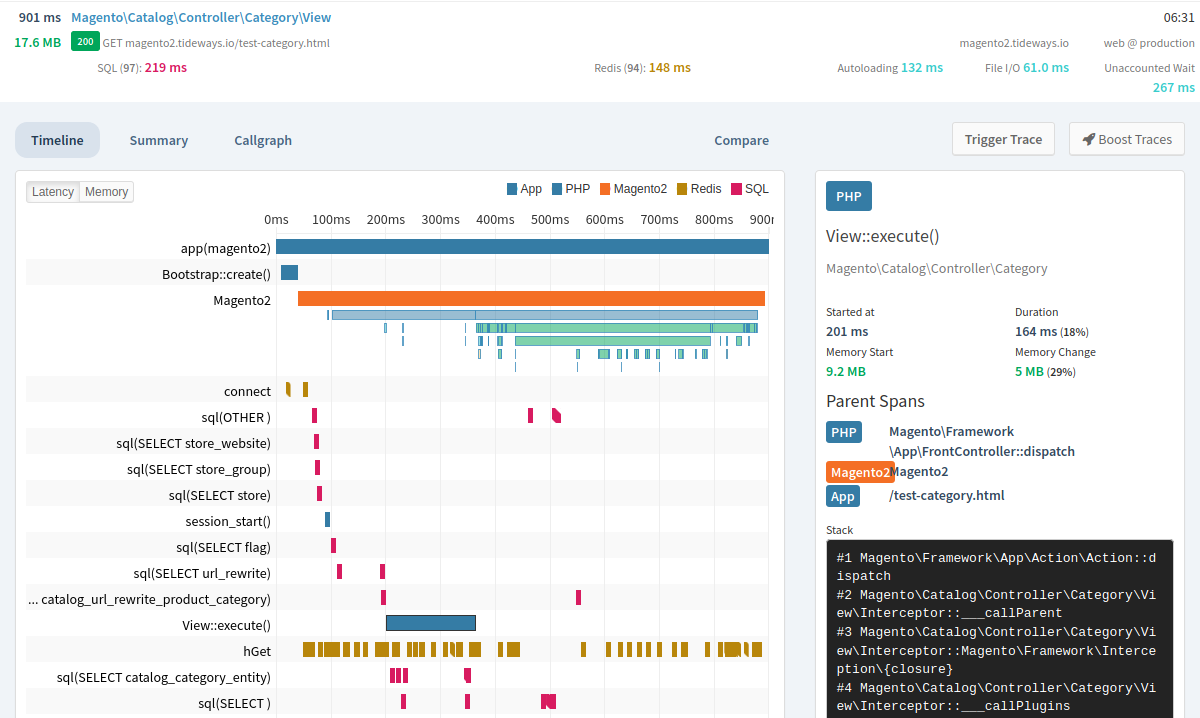
- The Timeline / Tracing Profiler
-
The Timeline Profiler collects information about a range of operations performed by your application, such as SQL statements, HTTP requests, framework controllers, event listeners, and rendering of templates.
This information is displayed in a timeline from the start of the request at 0ms to its end, much like the timeline in the Chrome or Firefox network performance overview.
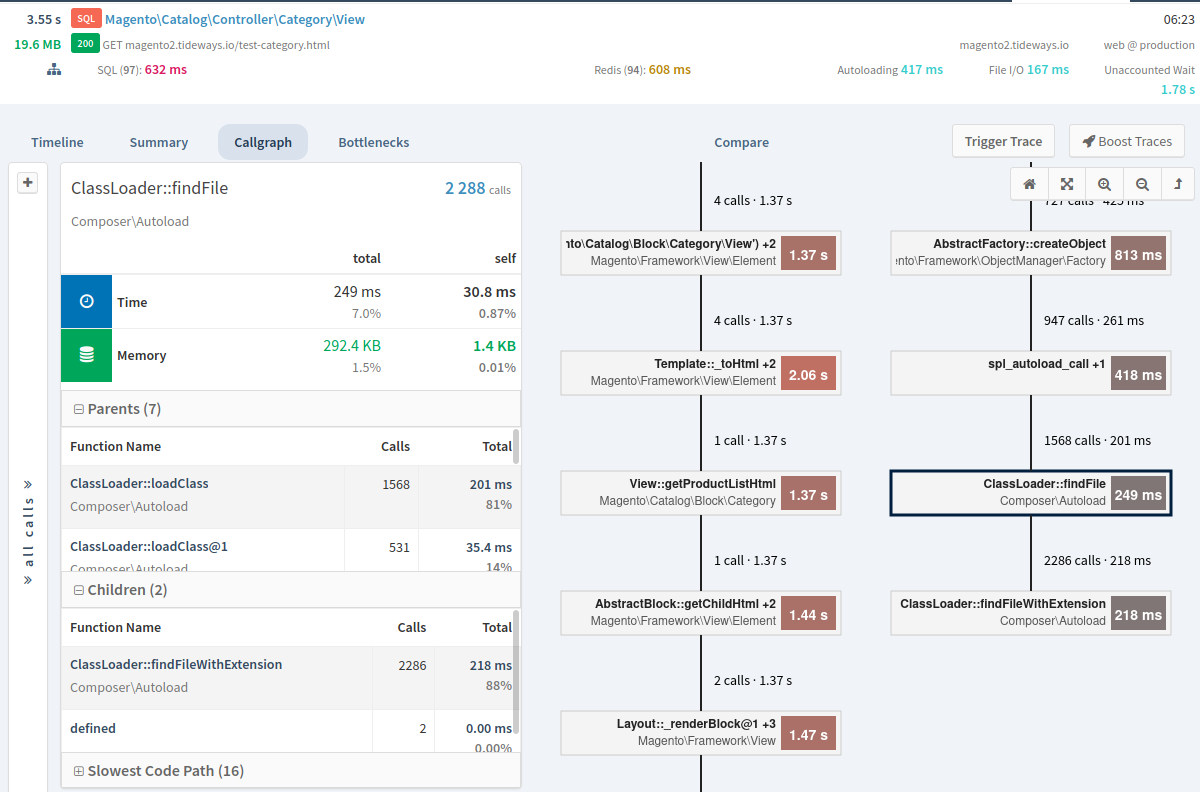
- The Callgraph Profiler
-
The Callgraph Profiler collects data about every PHP function called during a request. Navigation is possible through either the table based representation of all function calls or the visual callgraph.
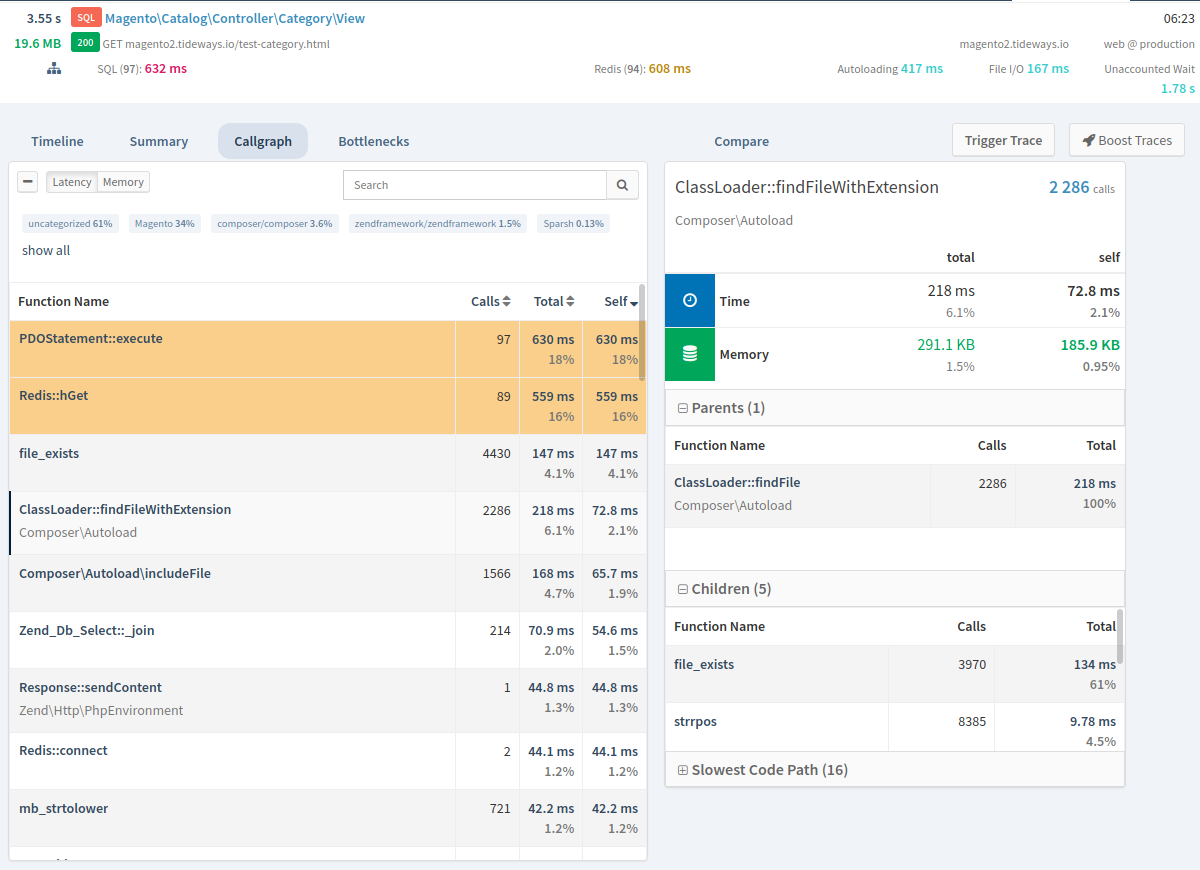
This way you can identify the slowest function calls and inspect the stack trace that leads to execution.
By drilling down into a profiler’s results, you can often be pleasantly surprised — though more likely shocked to find that your application is executing code paths and classes that you never expected.
Exception Tracking
When application requests are failing completly with unexpected errors the Profiler is not the right tool to find the cause.
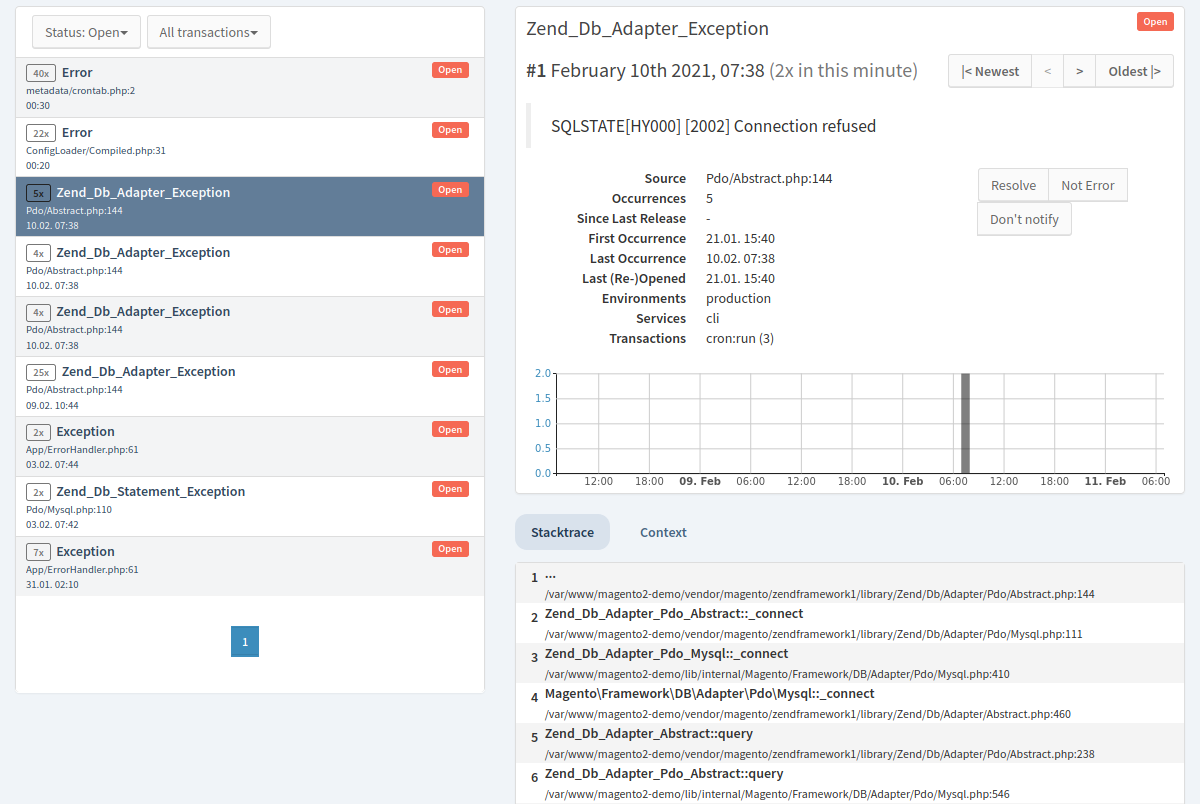
Exception tracking tracks details for failed requests including error messages, stack traces and context information. Tideways automatically detects PHP fatal errors and exceptions. Similar errors and exceptions are aggregated so that you get a picture of which error causes the most trouble.
In Summary
That’s a rapid overview of Tideways, focusing on its three core concepts of profiling, monitoring, and exception tracking. By using these three in combination, you can quickly go from a high-level overview down to a low-level, fine-grained understanding of where the problems in your application lie and how to fix them.
The following videos in the Tideways Academy course will focus on the nitty gritty details of these features and help you get the most out of your Tideways account. If you have questions you can always e-mail [email protected].