6. How to Boost Transaction Trace Rates With a Tracepoint
By now, you should have gotten a solid understanding of the essential aspects of what Tideways is and how it works. Now, we’re going to dive deeper and learn about a new aspect of functionality in Tideways, called Tracepoints. We’re going to learn how to create, view, edit, and remove them. By doing this use them to boost transaction trace rates.
If you are not familiar with traces, then check out then have a look at the definition in chapter 4 (Timeline (Tracing) Profiler). Alternatively, check out the Tracepoints documentation.
What is a Tracepoint?
So, what is a Tracepoints?
A Tracepoint provides fine-grained control over trace sampling rates.
It does this, because it allows you to influence the algorithm that decides which traces are sent and stored in the Tideways backend.
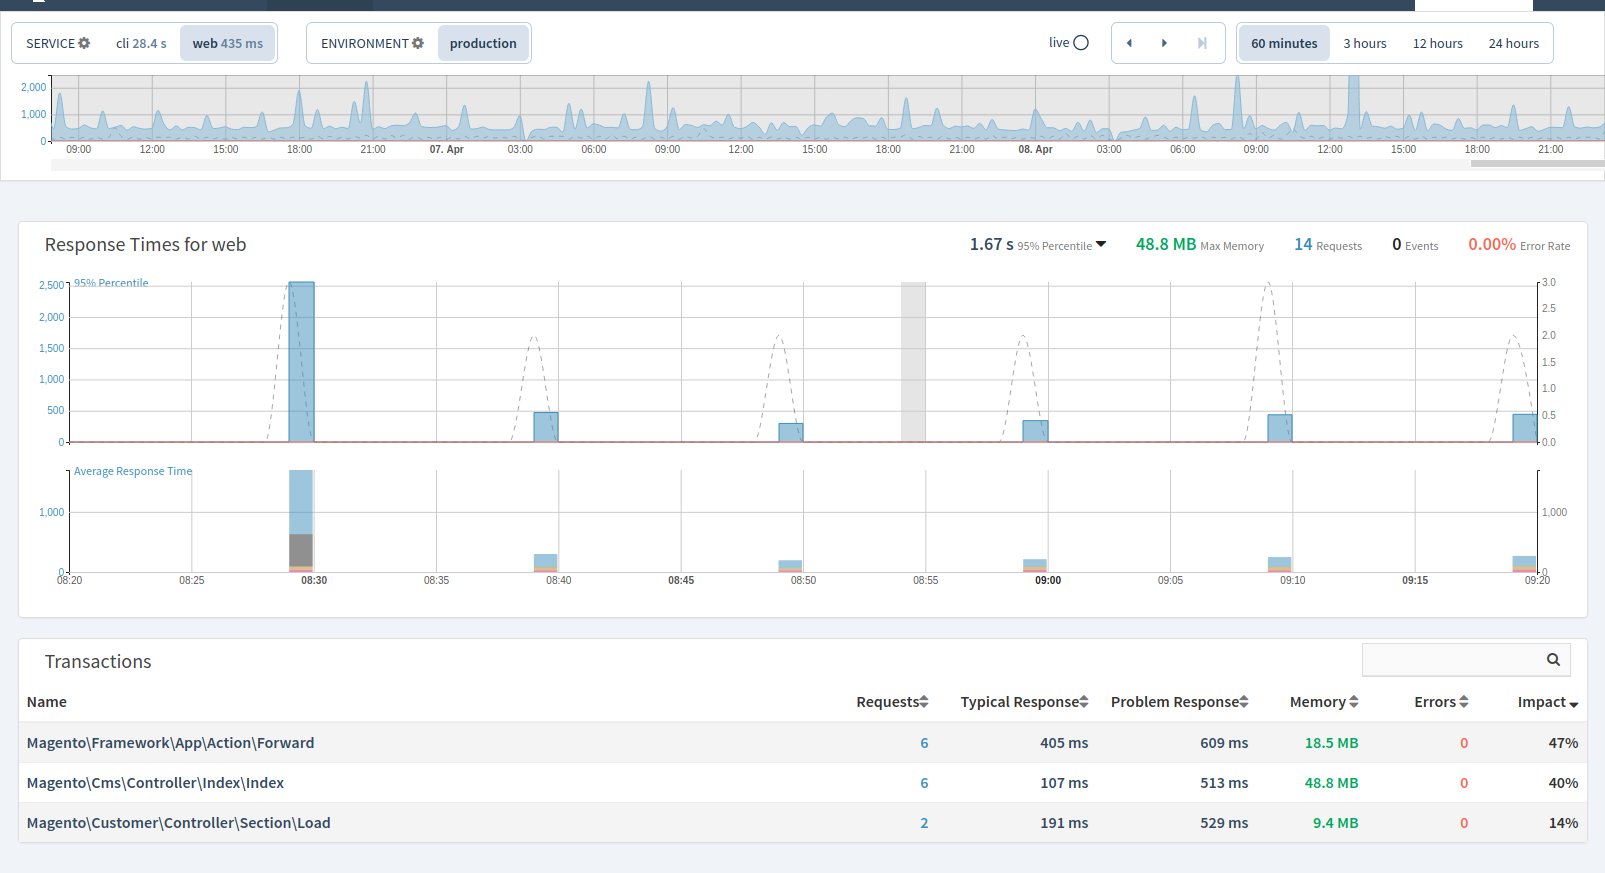
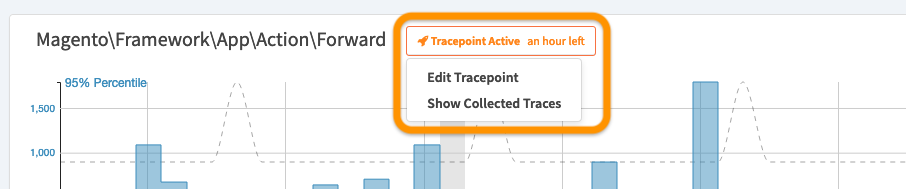
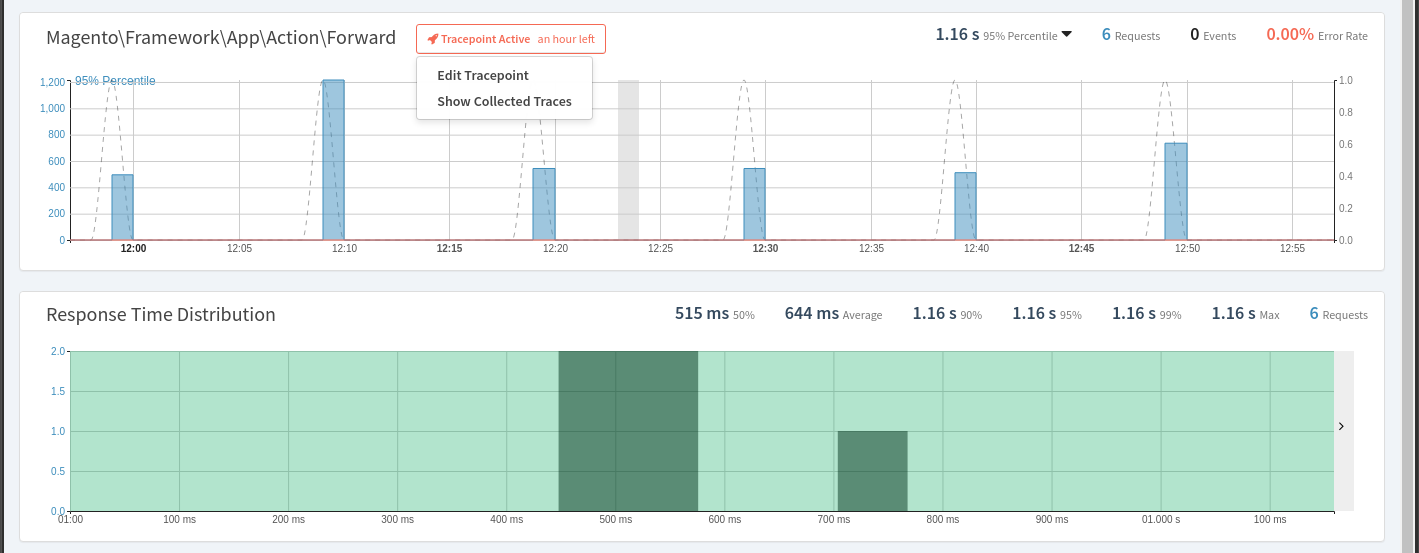
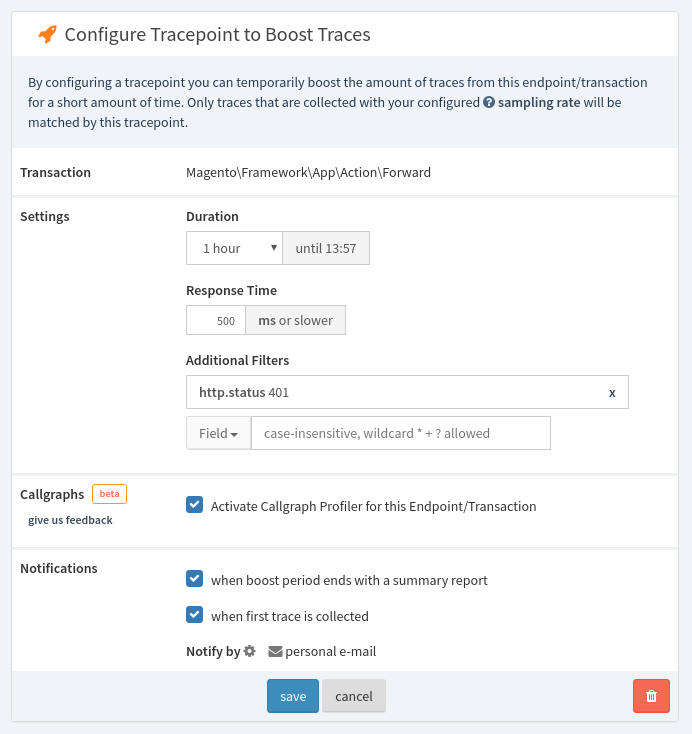
For example, if you are investigating a transaction to improve its performance, such as Magento\Framework\App\Action\Forward, which you can see in the screenshot below, you could boost the transaction trace rate which Tideways collects for that transaction, for an hour or longer.
Here are three examples of Tracepoints that you could use:
-
Keep all traces of a transaction where the response time is slower than a certain number of milliseconds
-
Keep all error traces of a transaction which have an HTTP 500 status code
-
Keep all traces of a transaction that are made against a customer’s subdomain, e.g.,
customer.myproduct.com
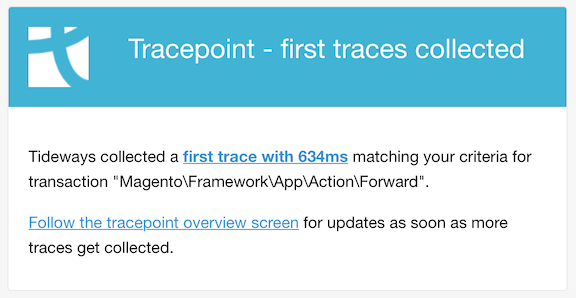
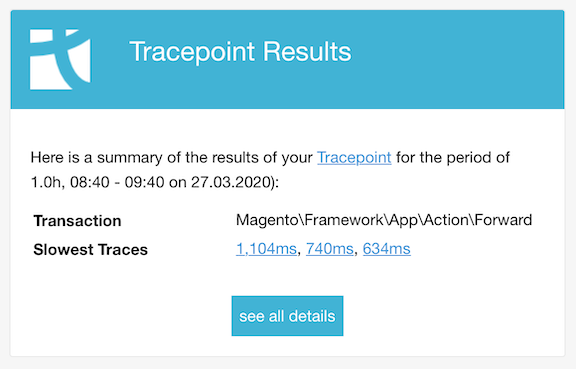
You can also configure Tracepoints to send helpful summary reports, whether by email or to an integration such as Slack, as soon as the Tracepoint expires, which highlight the slowest traces collected.
How to Create a Tracepoint
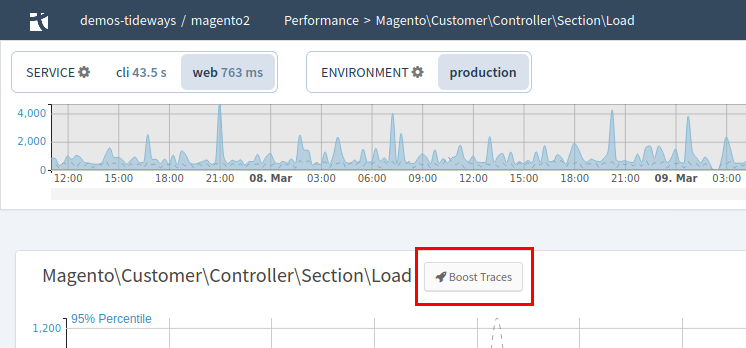
To create a Tracepoint, you first drill down into the desired transaction of your application. Once there, click the Boost Traces button, located at the right of the transaction’s name in the Transaction Performance Chart.
You will then see the Configure Tracepoint to Boost Traces form.
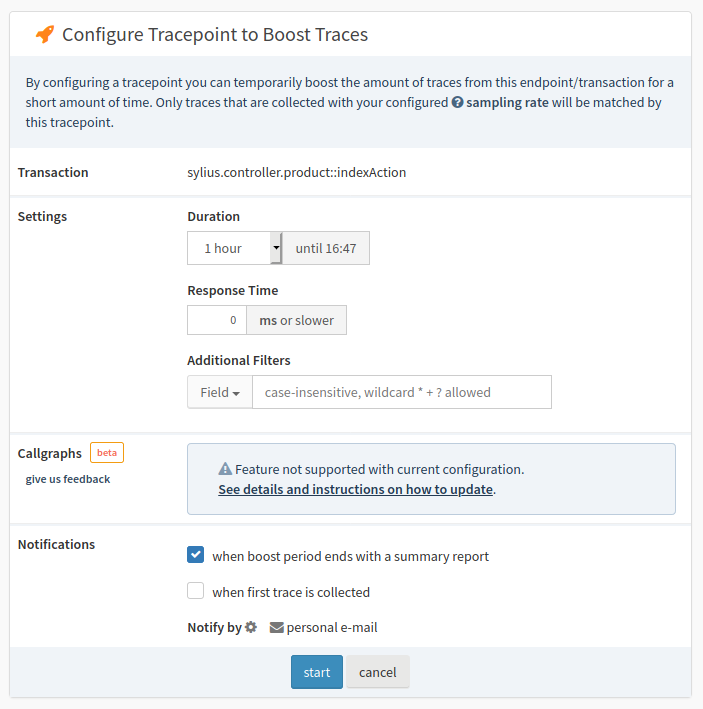
The form supports three categories of configuration options: Settings, Callgraphs, and Notifications.
- Settings
-
This is where you can configure the duration, minimum response time threshold, and a combination of additional filters. The duration can be one of 1, 2, 3, 6, 12, or 24 hours. The response time specifies the minimum response time. The additional filters are HTTP host, HTTP URL, HTTP status code, HTTP method, and custom annotations. We’re not covering custom annotations in this chapter, only the other four additional filters.
The additional filter values are case-insensitive and can contain wildcards, those being * and ?.
|
- Callgraphs
-
Under Callgraphs, you can activate the Callgraph Profiler for this transaction. This elevates requests for this transaction to collect detailed callgraph profiling data, in addition to the regular timeline data.
| If you’d like to know more about the Callgraph Profiler, check out video 5. |
- Notifications
-
Notifications is where you configure how you are notified about the results of the Tracepoint. You can choose to be notified with a summary report when the boost period ends, when the first trace is collected, or both. By default, you are notified via email.
However, the default notification rules can be changed, and additional ones can be created. We’re not going to go into that in this video. I strongly encourage you to both experiment with the default rules as well as to read through the notification’s documentation.
In the screenshot below, you can see that in Settings:
-
Duration is set to 2 hours
-
Response Time is set to 500 milliseconds; and
-
Three additional filters were added. The first one sets
http.hosttotideways-sylius-demo.herokuapp.com. The second one setshttp.statusto500. The third one setshttp.methodtoGET. I added multiple filters so that you get an idea of the various ways in which you can configure them. -
In "Notifications", I left "when boost period ends with a summary report" checked.
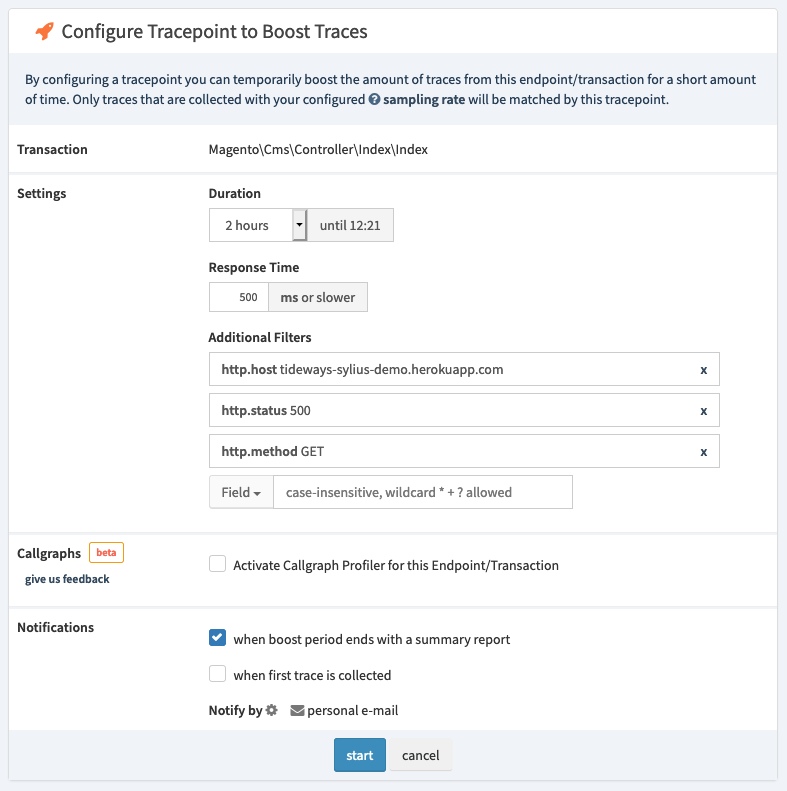 Figure 1. Create a Tracepoint with multiple filters
Once the form is filled out, click start, to create the Tracepoint. After this, you are redirected back to the original transaction, where we clicked the "Boost Traces" button. At this point, a Tracepoint, similar to a breakpoint in debugging, has been created.
It’s sent from the Tideways backend via the daemon to the PHP extension. Synchronization of the two can take a little while, typically around 1-3 minutes, so please be a little patient before expecting to see results.
Viewing Collected Traces for a Tracepoint
To view the Traces collected for a Tracepoint:
-
Open the Trace with the active Tracepoint. You will see a button, labeled "Tracepoint Active" (the label will also include the time remaining for the Tracepoint).
-
Click Tracepoint Active, and in the dropdown menu that appears, click Show Collected Traces. You will then be redirected to the Tracepoints view.
-
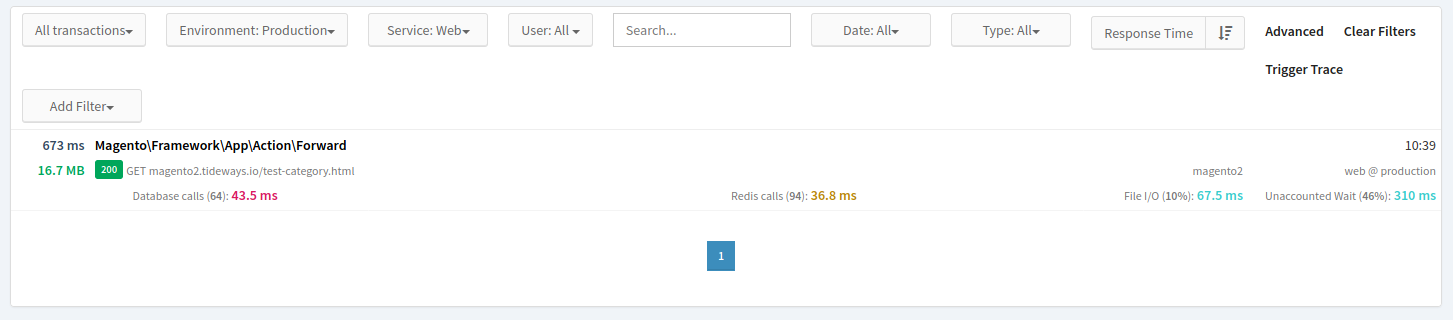
Click show all traces… on the far right-hand side of the Tracepoint that you want to view traces for.
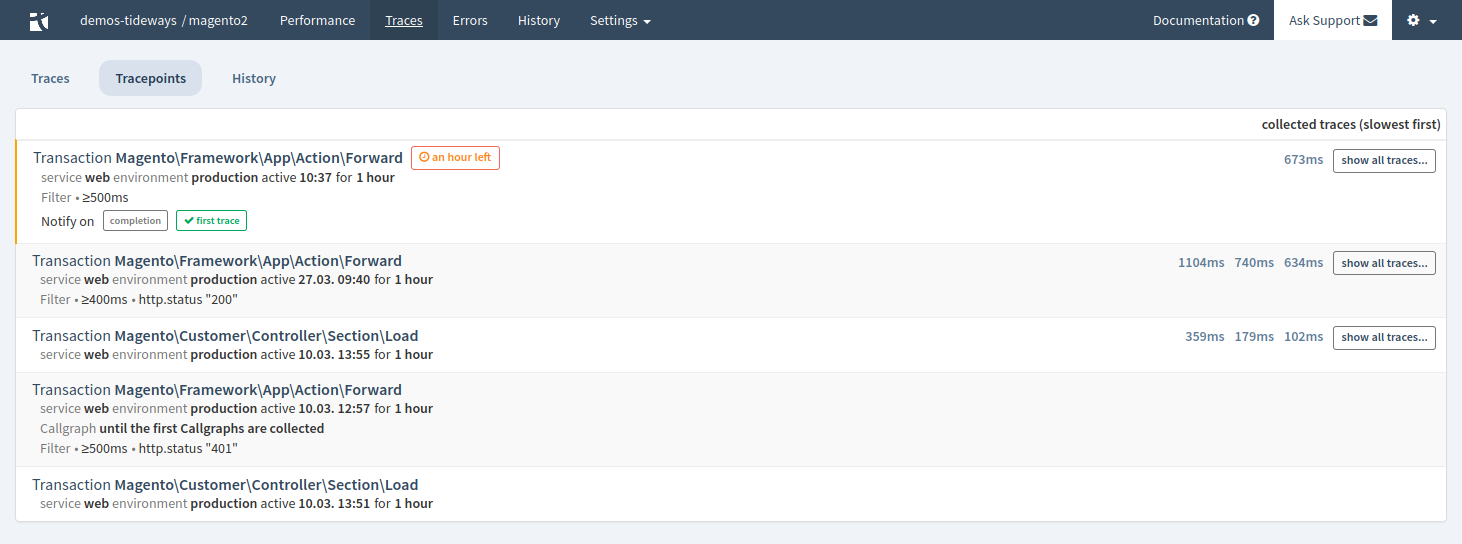
You will then see all the traces for that Tracepoint.
Editing and Removing Tracepoints
When a Tracepoint is active, an icon is visible next to the Transaction’s operation name. If you drill-down into the Transaction, in place of the "Boost Traces" button, which we saw before, a notification, telling you that the Tracepoint is active, along with the amount of time remaining for it, is now visible.
If you click on the notification, you can edit the Tracepoint and view the collected traces. If you click Edit Tracepoint, you will be taken back to the Configure Tracepoint form, where it is pre-populated with the existing configuration.
Also, in the bottom right-hand corner of the form, is a rubbish bin icon. If clicked, the Tracepoint will be stopped and removed, and you will be redirected back to the Transaction again. If you click Show Collected Traces, you will be redirected to a list of existing Traces.
The Summary Email
If you enabled "when boost period ends with a summary report" or "when first trace is collected", under "Notifications", then you will receive an email at those times. Here are examples of what both look like, so that you know what to expect.
In Summary
And that has been a rapid introduction Tracepoints, and how you can use them to boost transaction trace rates. We’ve seen how to create, edit, remove, and view them. And we’ve also seen examples of the summary emails that are sent when the first traces are collected and when the Tracepoint is completed.
If you would like more information about them, then check out the Tracepoints, Tracepoints, and Traces Overview sections of the Tideways documentation.