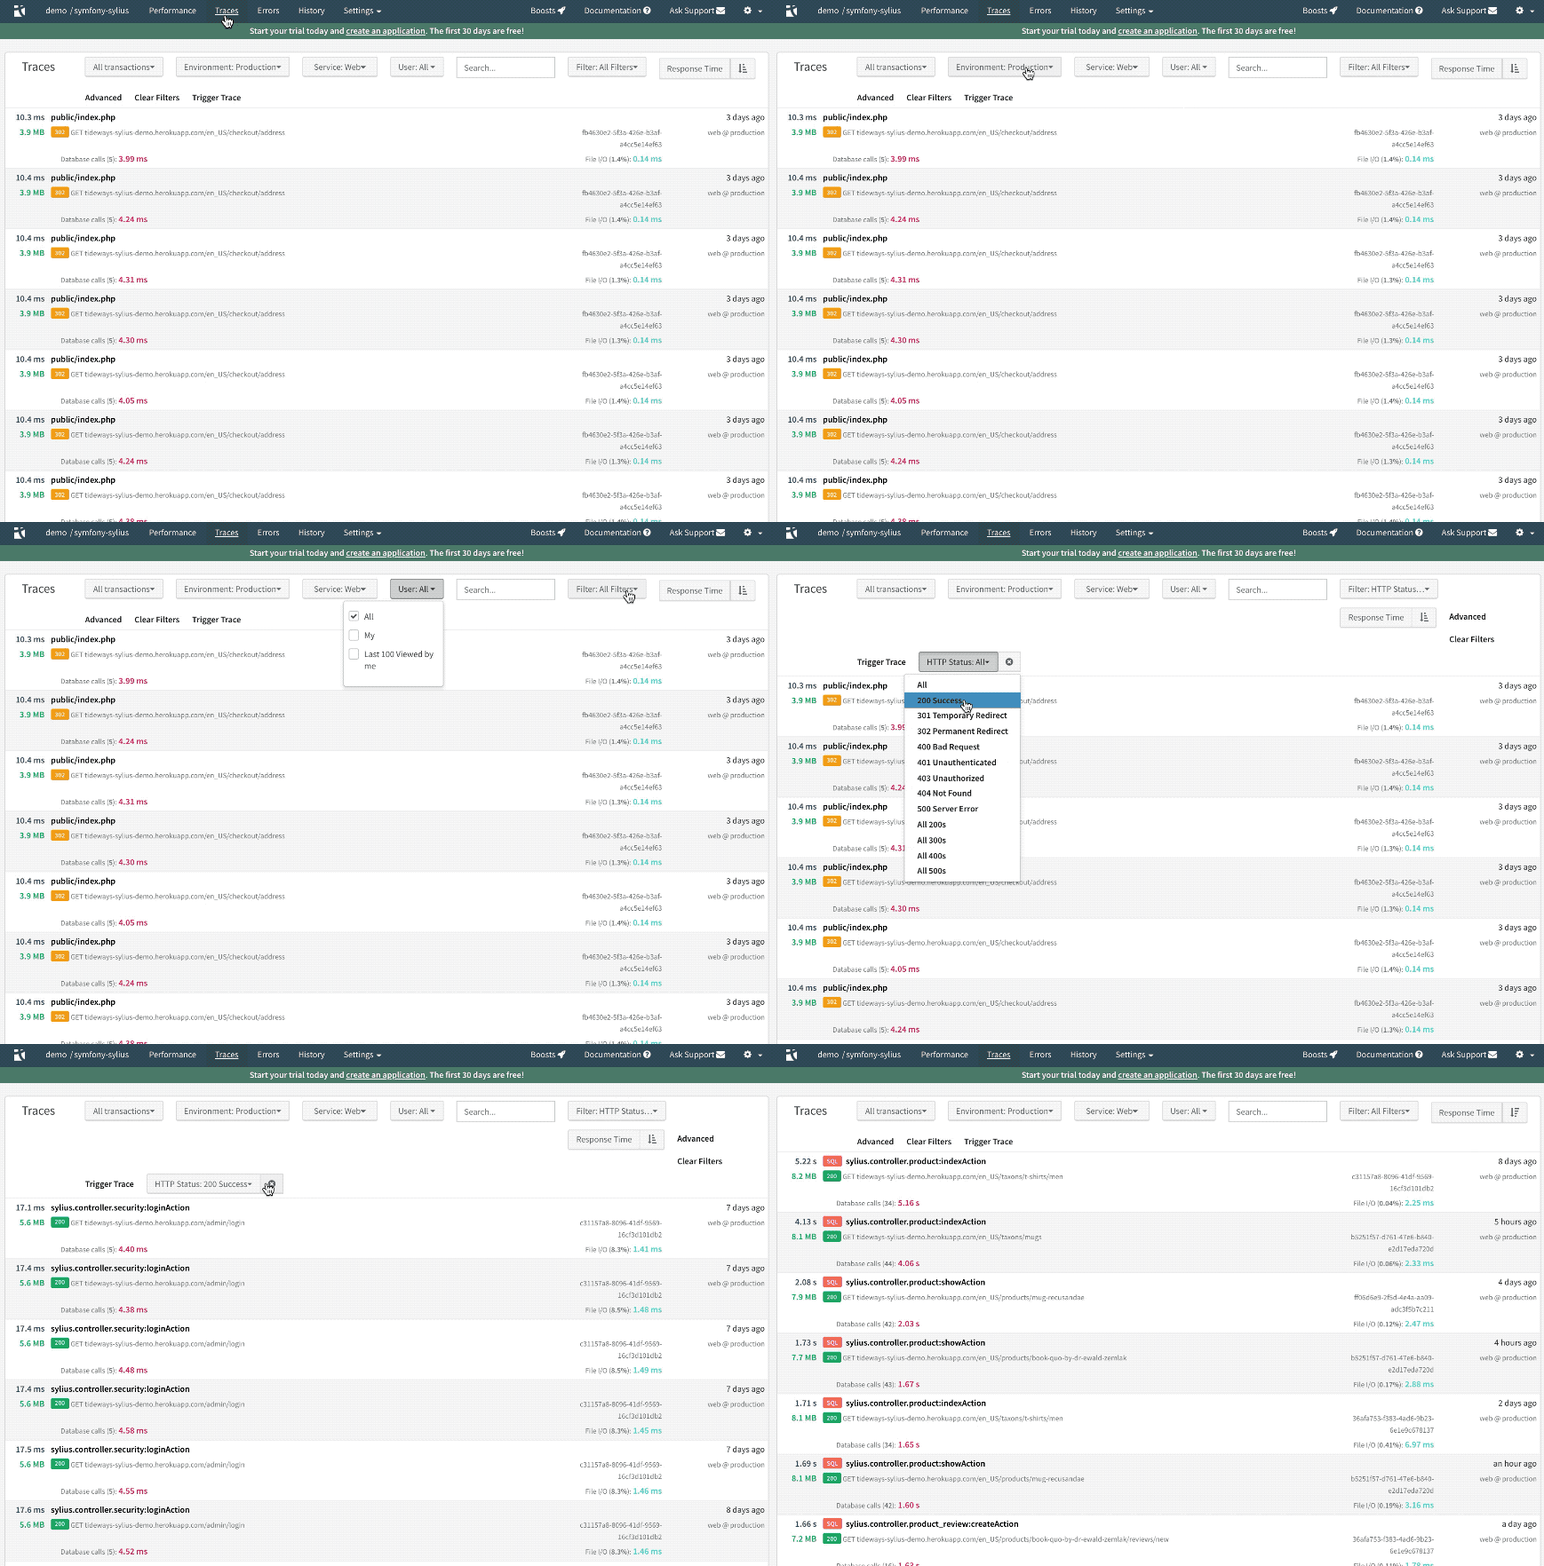
Traces Overview
Collecting Traces is the heart of Tideways and provides valuable insights into the performance of individual requests, either triggered directly by your projects users.

Details of the request are summarized to help give you an immediate overview of the performance of the trace; these include:
-
Name of the transaction and for web-requests its URL and HTTP Status code.
-
Non-CPU time - that means all time this request spent in CPU wait or I/O wait states.
-
Response time of the complete request in milliseconds
-
Server and date of collection
-
The total memory size allocated to the request
-
Time spent in layers such as Database, HTTP and Cache. In the example above "Database (9): 4.02ms" means that a total of 9 database queries took a combined time of 4.02 milliseconds in this request.