StatsD
StatsD is a NodeJS network daemon that aggregate application metrics data and flushes periodically over UDP port to backend services. It works very fast with UDP protocol, which not checking received data and sends data with fire-and-forget. For StatsD is not significant if some data isn’t received.
Tideways integrates with StatsD and DogstatsD (Datadog Implementation of StatsD) by sending response times, request numbers and errors from tideways-daemon to a any kind of process that supports the StatsD protocol in your infrastructure.
For Configuration parameter --statsd or --dogstatsd in tideways-daemon you can find the documentation here tideways-daemon Configuration Reference.
View with using --statsd with tideways-measurements data in Librato as backend for statsD:
Here is an example with usage --dogstatsd integrate in tideways-daemon and sending to Datadog as backend.
In Datadog calls the network-daemon DogstatsD.
It implements statsD with specific extensions, but some things are not implemented how gauge delta or timers as a native metric type.
It little bit different, but works very similar how statsD.
Insert the flag --dogstatsd into configfile /etc/default/tideways-daemon.
TIDEWAYS_DAEMON_EXTRA="--dogstatsd=127.0.0.1:8125"Restart the tideways-daemon with the command:
sudo systemctl restart tideways-daemonThen configure the Datadog-configfile /etc/datadog-agent/datadog.yaml with setting this (it is commented in the configfile):
# DogStatsd
use_dogstatsd:true

# Make sure your client is sending to the same UDP port
dogstatsd_port:8125
Finally restart the Datadog-daemon with the command:
sudo systemctl restart datadog-agentNow you can login in your Datadog-Account and create the Dashboards with tideways-metrics.
-
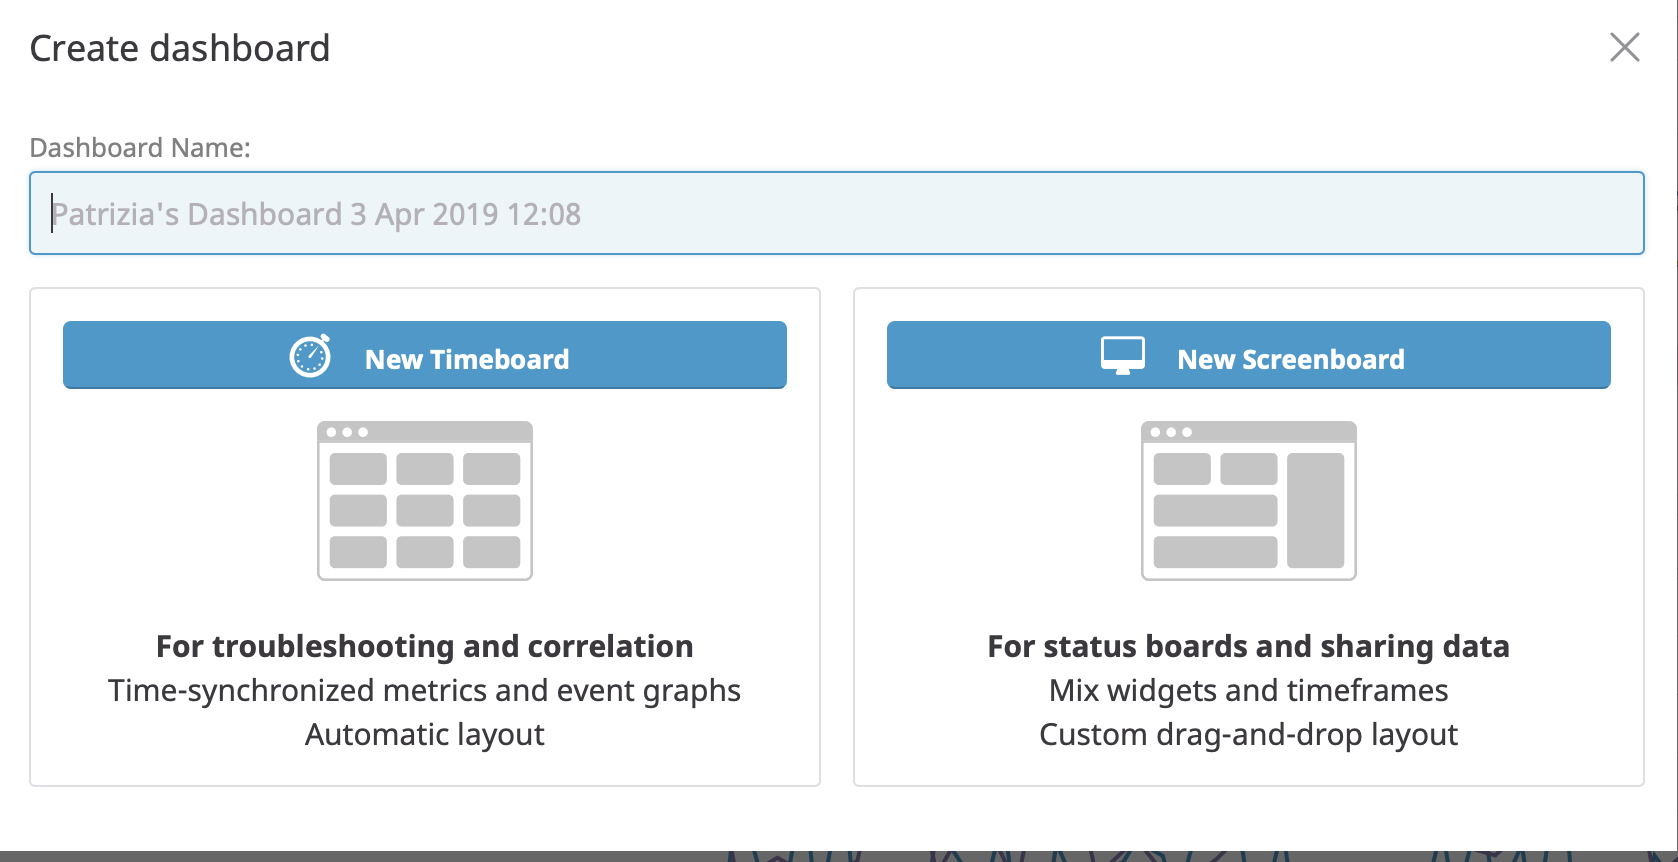
"Create Dashboard" and call it Tideways for example and select "Screenboard" to continue.
-
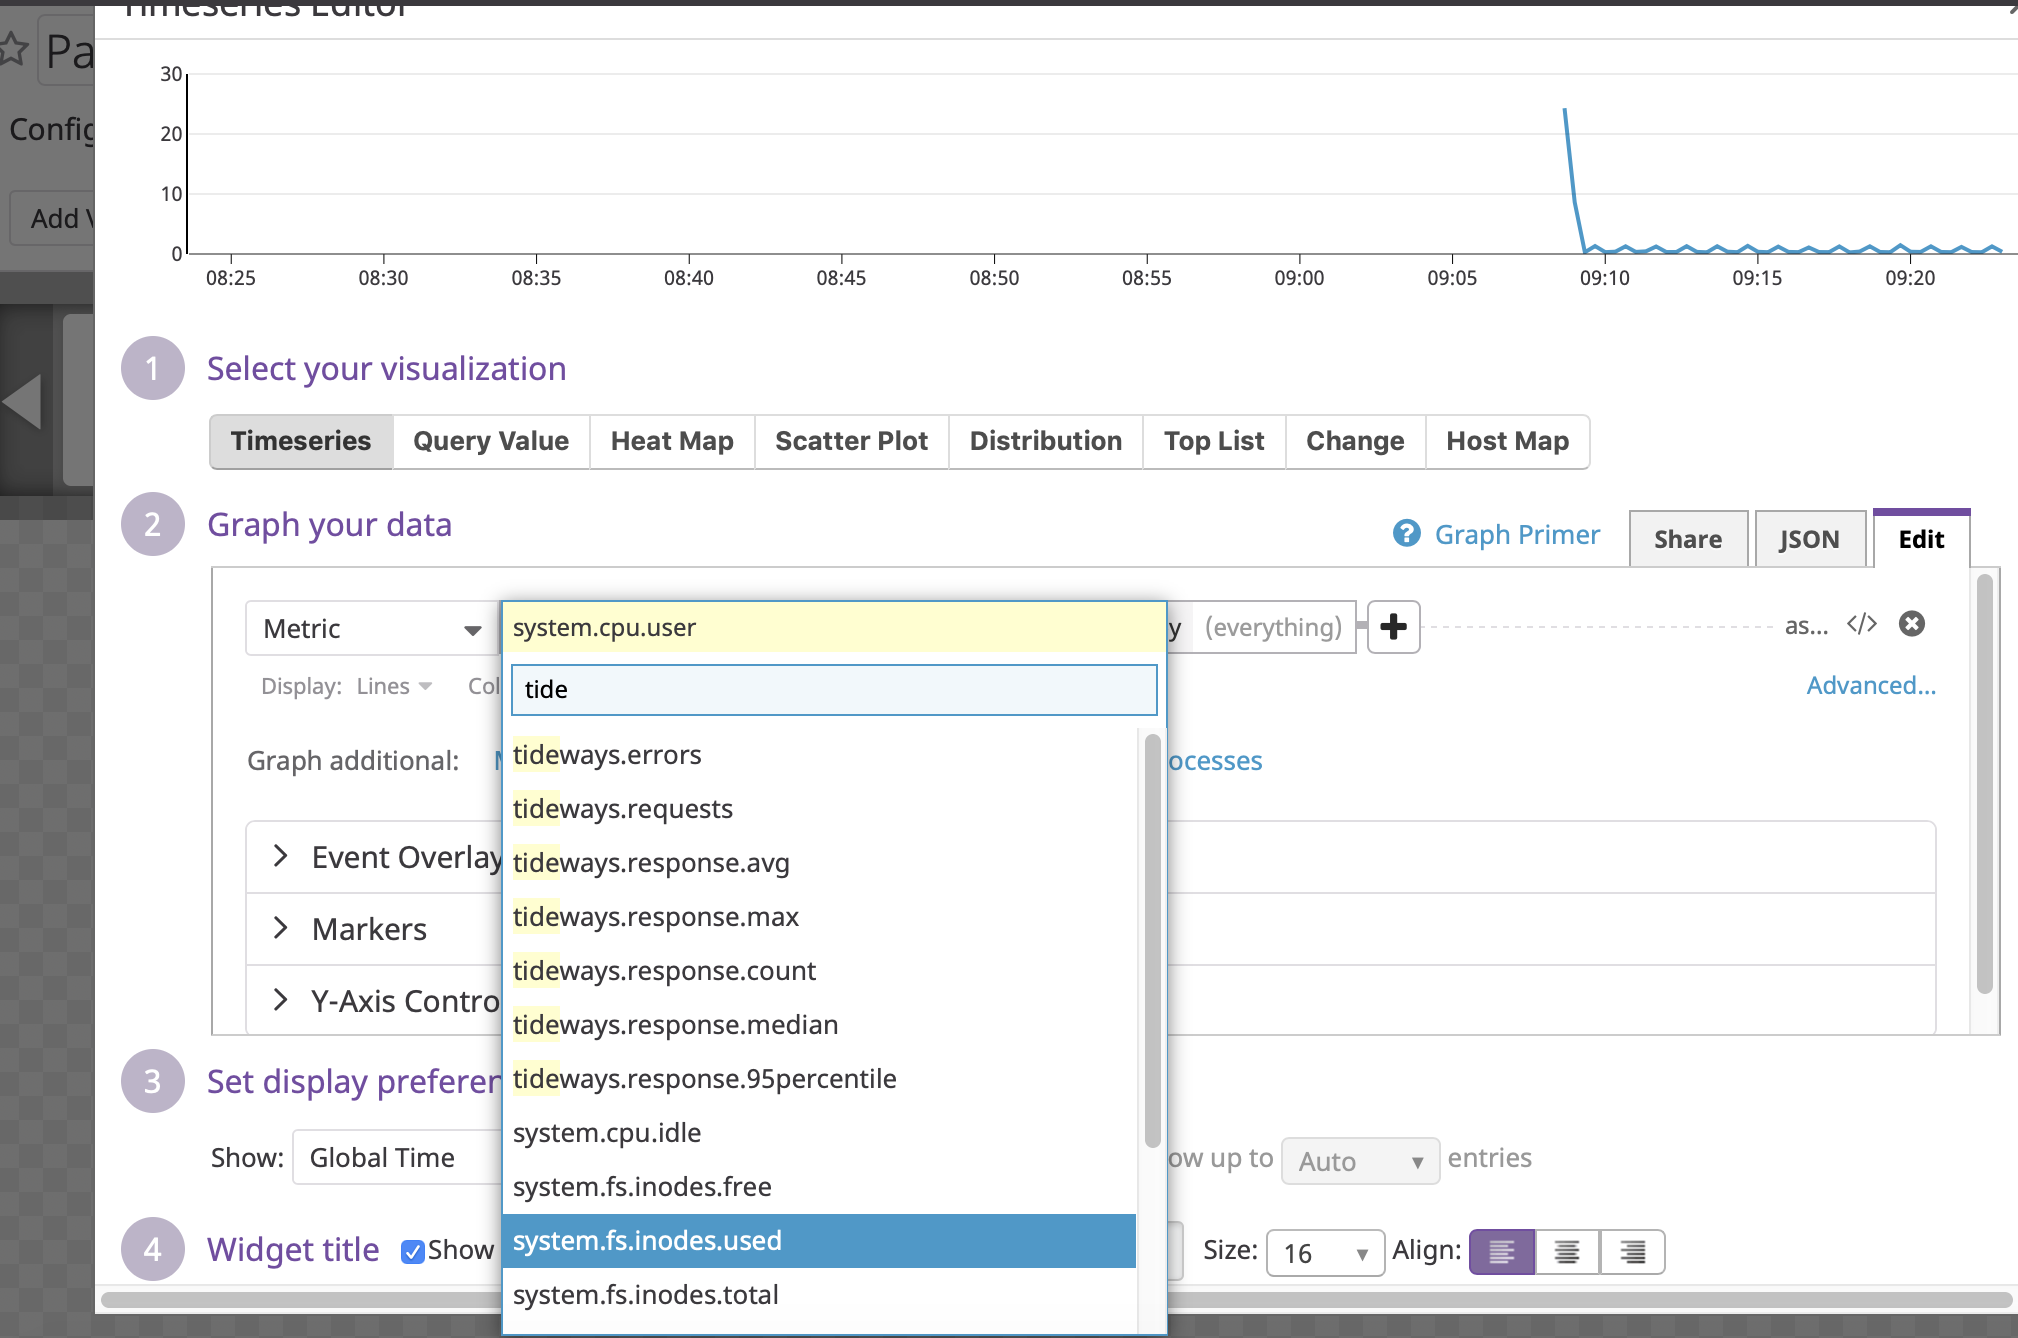
Choose the Timeseries-template and call for "Metric" tideways.errors, tideways.requests or other tideways-metrics how you need.
-
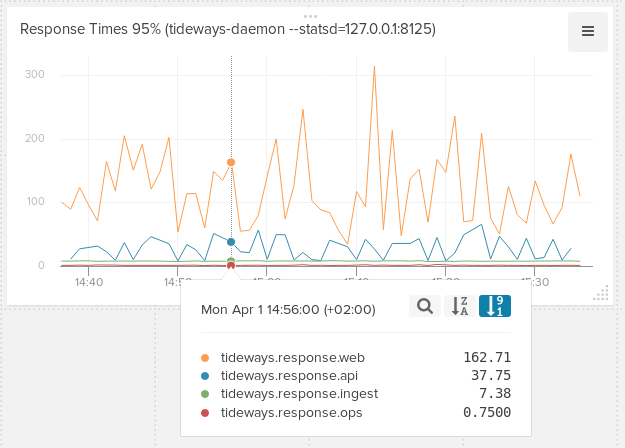
Here is an example of a finished screenboard with metrics data "tideways.response.95percentile", "tideways.requests" or "tideways.errors" for three different services.
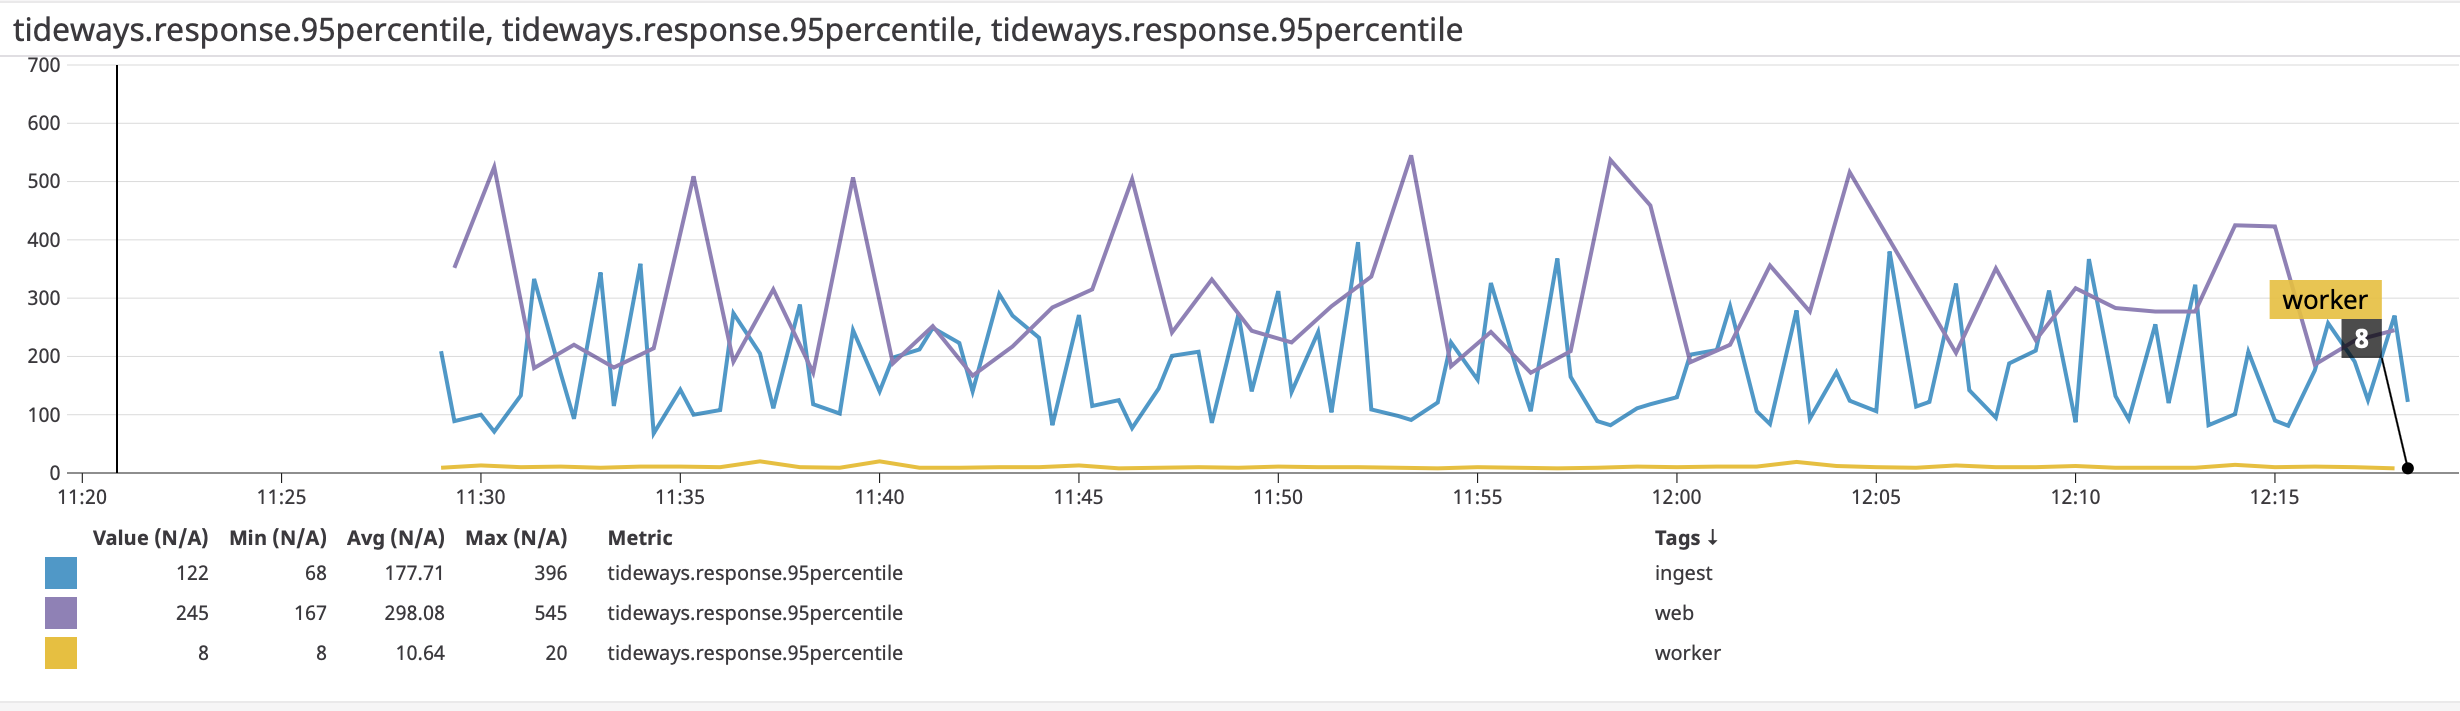
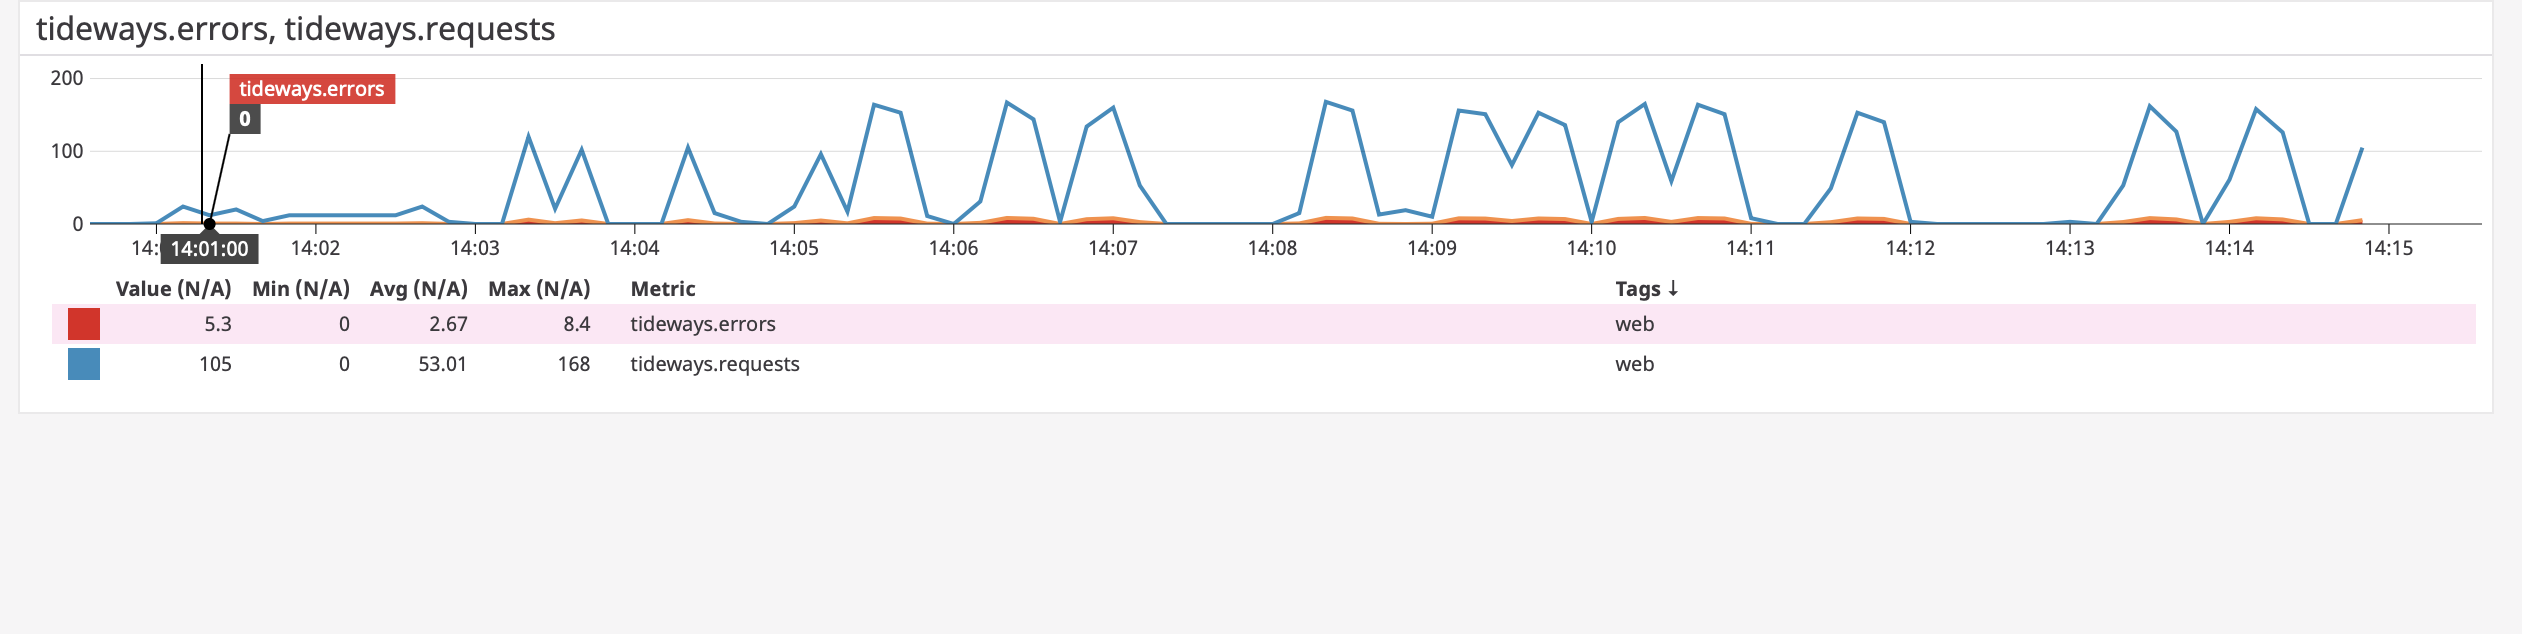
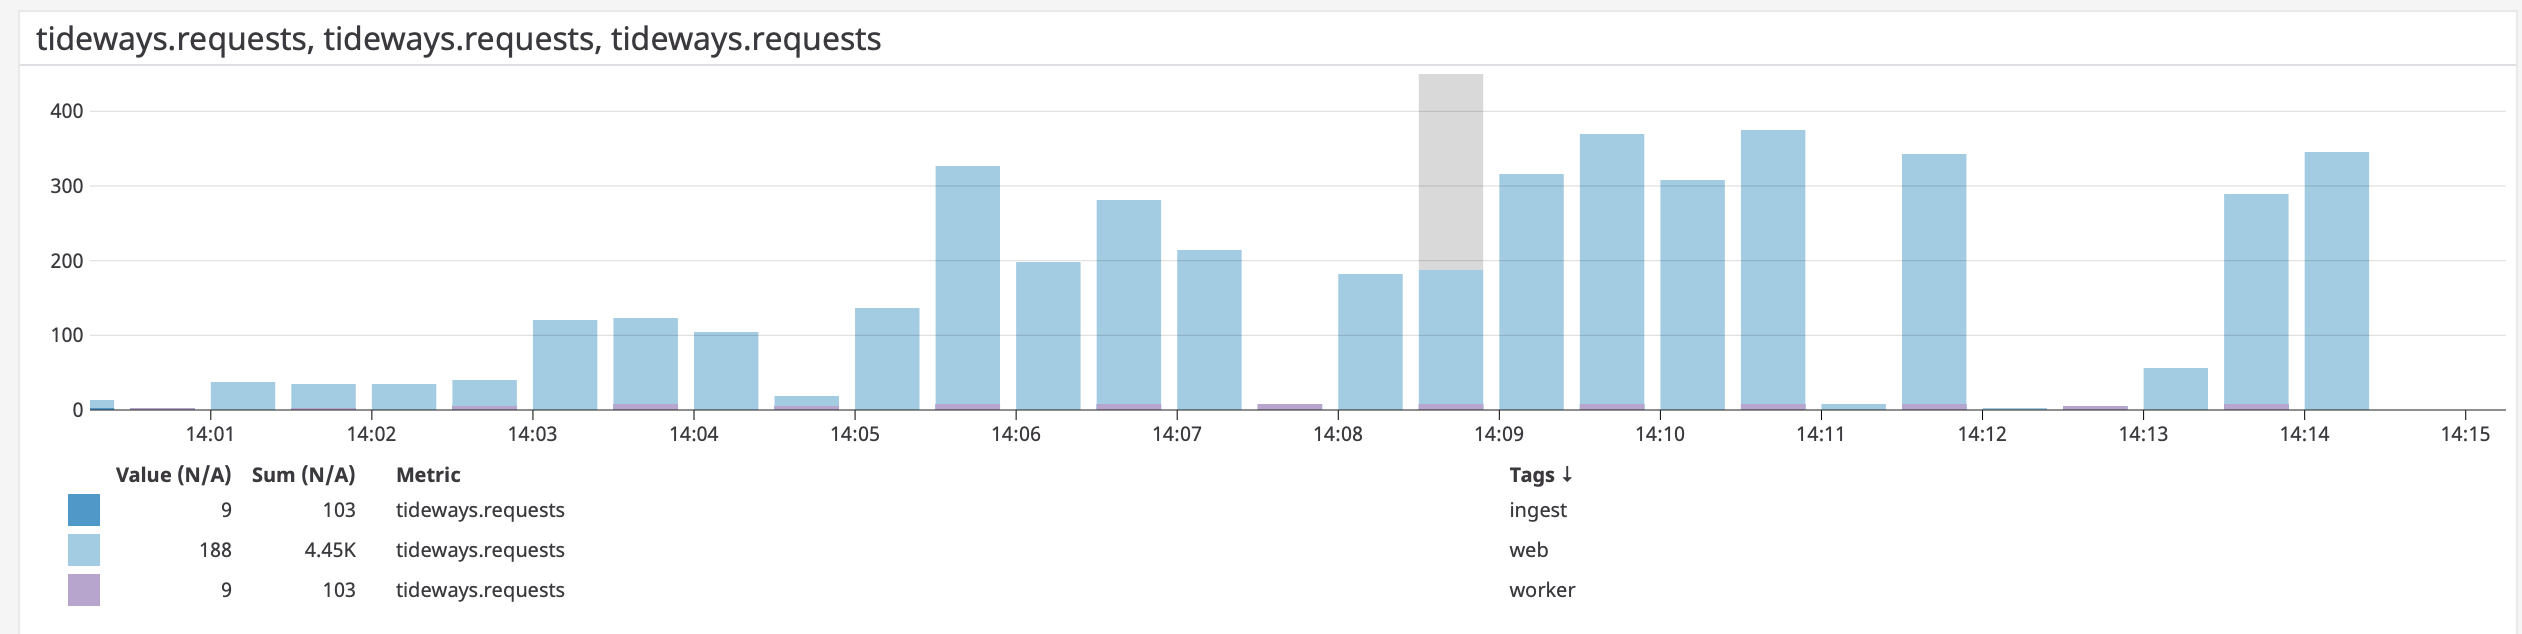
-
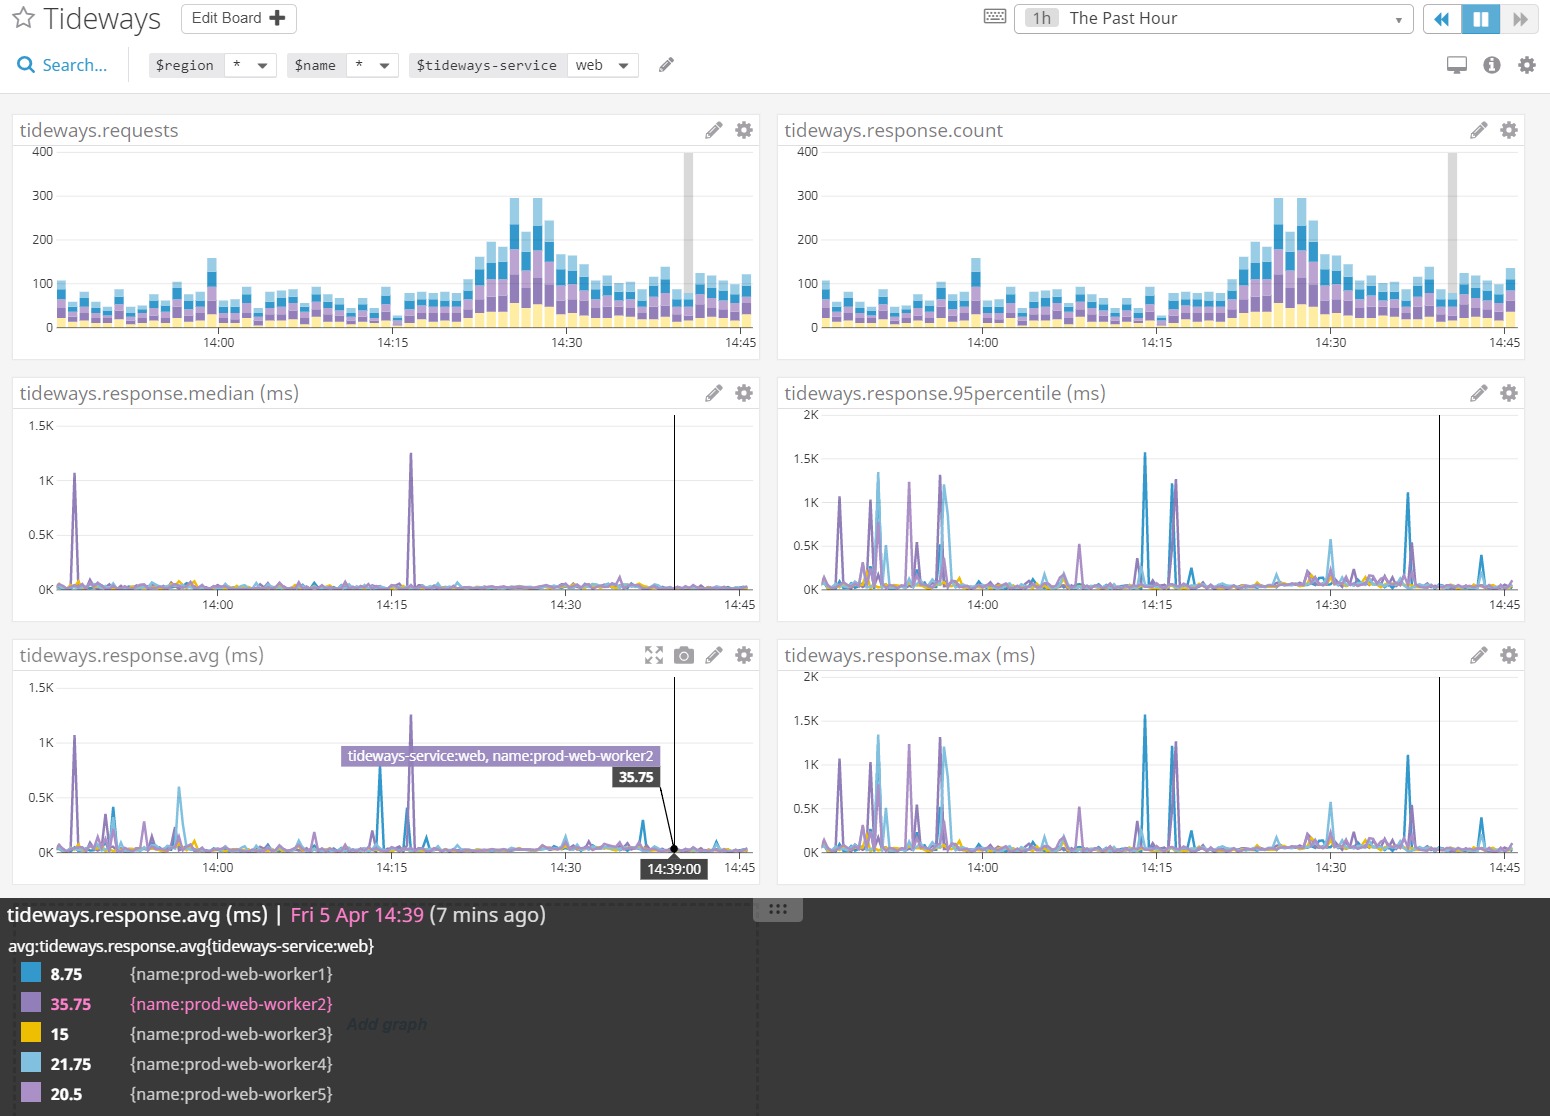
Here is an example of a Timeboard with the same metrics.