Introduction
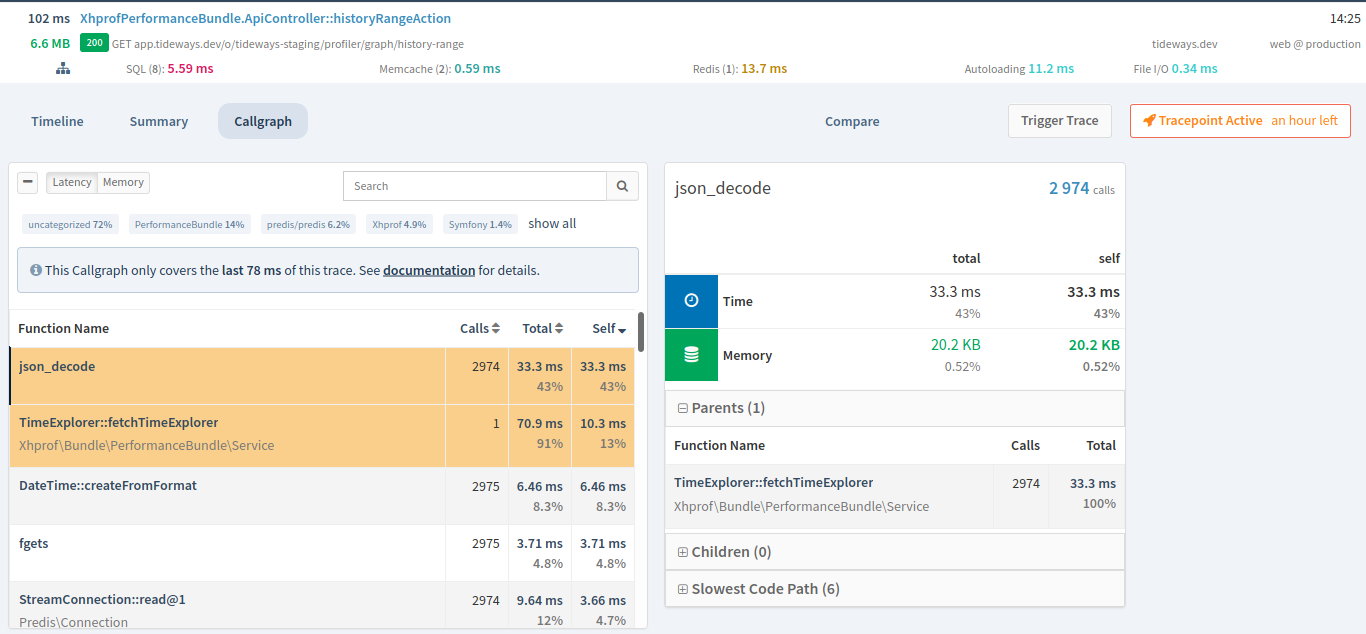
When you are debugging performance problems, a full callgraph can give you more detailed insights into every function call of your PHP requests.
When clicking on the Callgraph tab in the trace, a list of all functions called in the trace, sorted by the highest self-time (exclusive wall-time) is shown on the left. This means that the functions which contribute the most to the complete request’s response time are listed first.
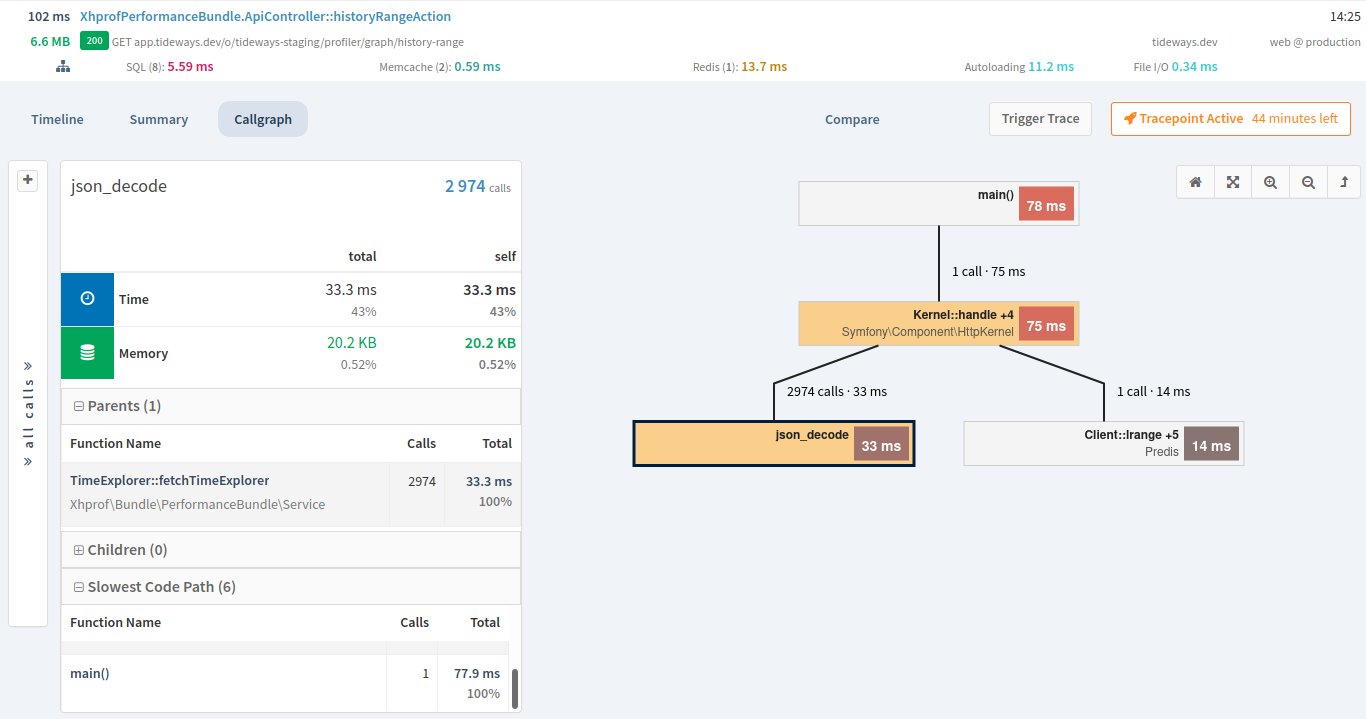
You can also view a visual representation of the callgraph, if you prefer this more detailed profiling to the timeline profiler. By clicking the minimize symbol on the left side of the list in the trace, you can see the callgraph from top-down, following the hot path.
| Because the Callgraph Profiler has a noticeable overhead over the Timeline Profiler, it is only available for developer triggered traces by default. |
Still need help?
Email [email protected]