Trigger from the Browser
The Tideways Profiler can be triggered from the browser, using the Chrome Web Extension.
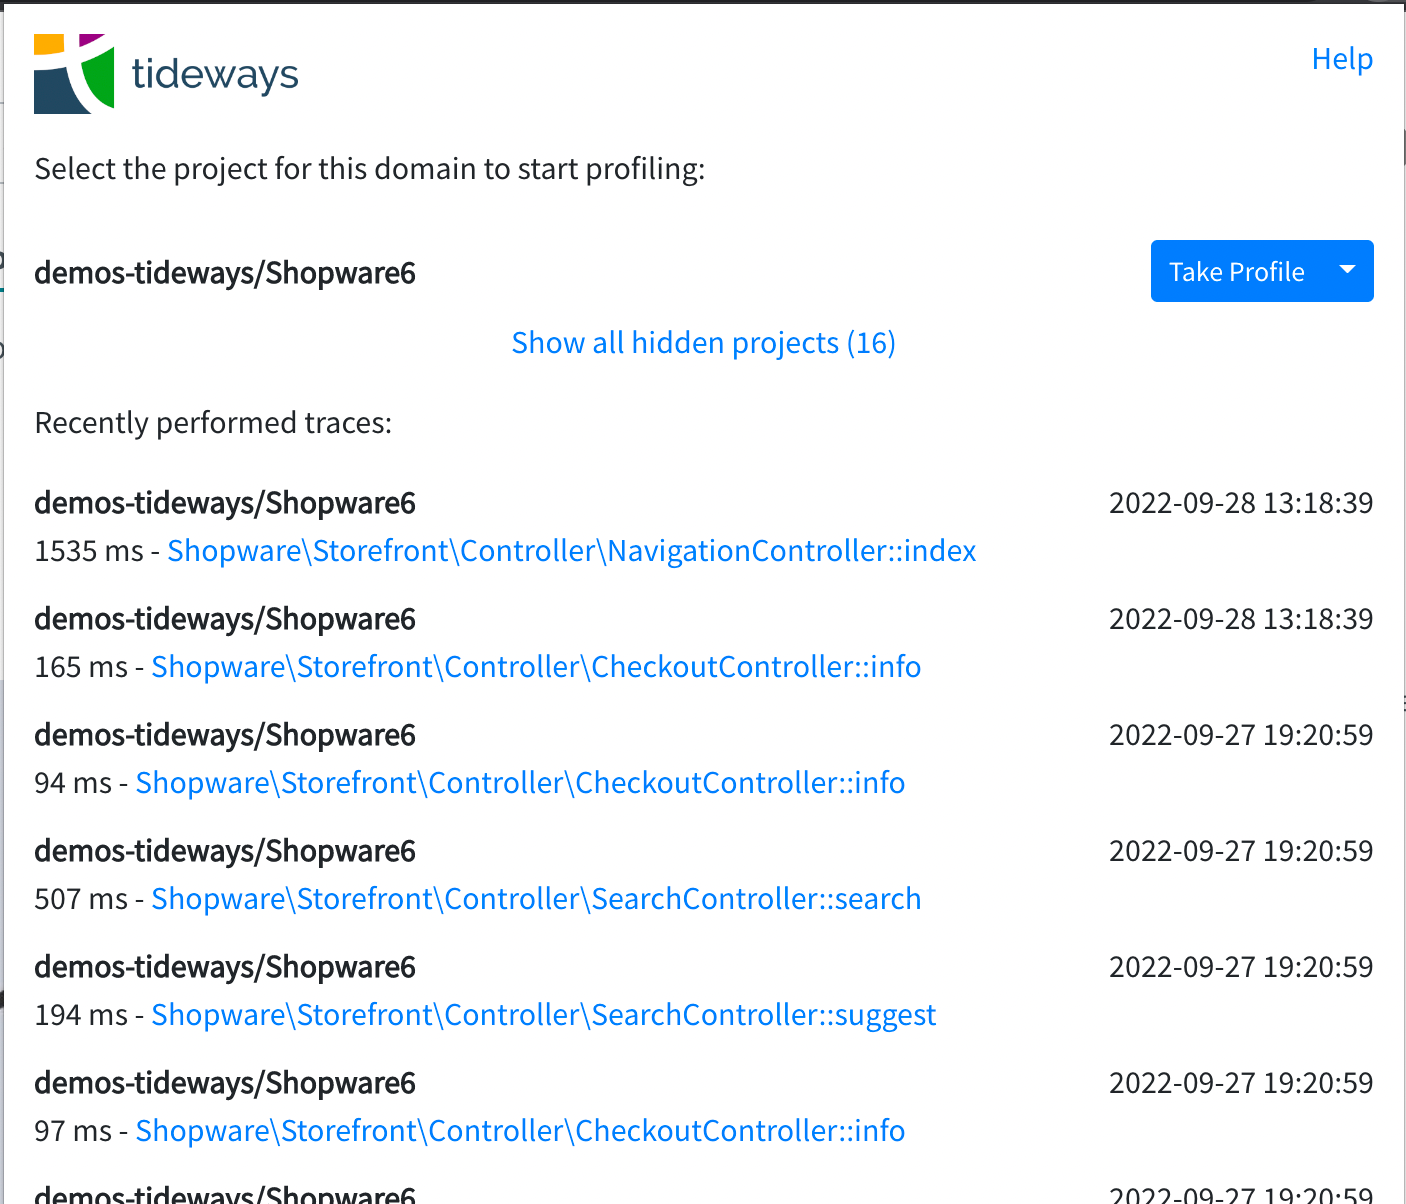
Click on the extension’s logo in the toolbar of the browser to see a list of Tideways projects that you have access to.
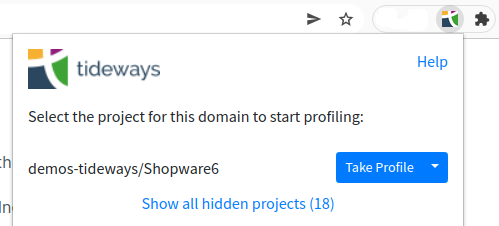
Trigger the Profiler for the currently open site by clicking on "Take Profile" button next to the projects name. Usually the project that matches the website you are currently visiting is highlighted on top.
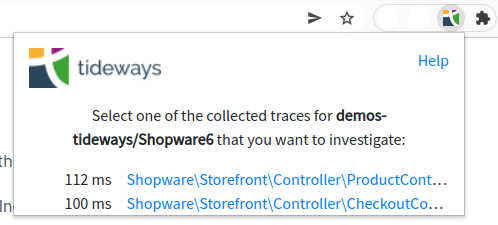
This will reload the page including a new cryptographically signed cookie that activates the Profiler including callgraph collection. A few seconds later the extension popup will show all traces that were collected by the trigger.
Start 15 or 60 Seconds Profiling Session
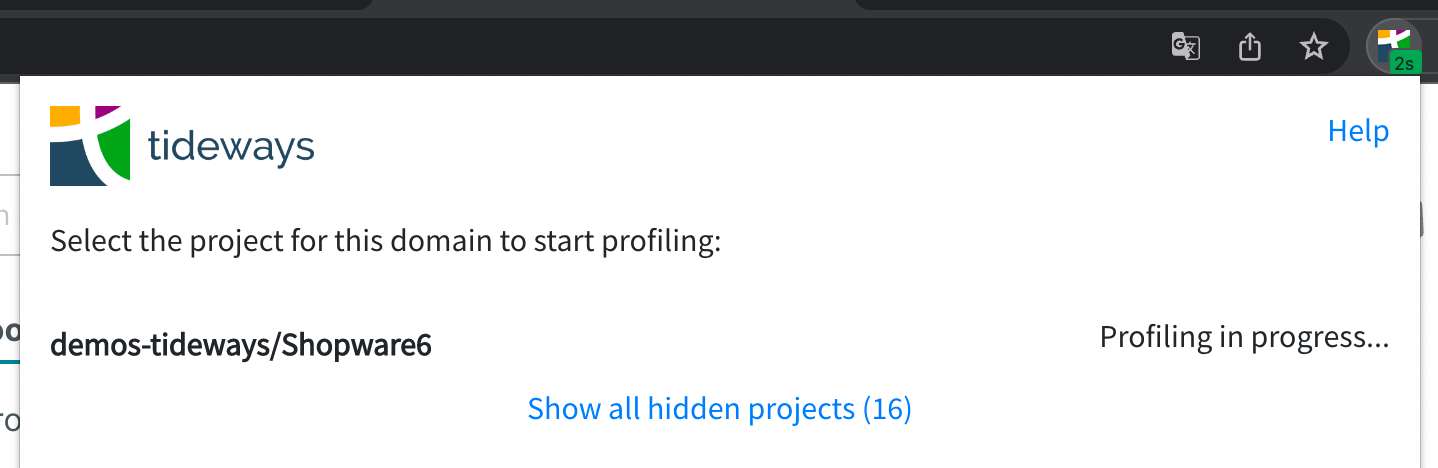
Alternatively click on the arrow down next to "Take Profile" and select "Profile for 15 seconds" or "Profile for 60 seconds" to start a profiling session that lasts a few seconds, collecting traces for all requests made by you. This includes any form submissions and Ajax requests.
The extension logo in the Chrome toolbar counts down how long the profiling session is still active. Once the session is over and the countdown turns into a checkmark, the extension has loaded the triggered traces from Tideways backend and they are visible in the "Recently Performed Traces" section.
Recently Performed Traces
To allow quick access to current profiling data, the main window of the Chrome web extension lists up to 10 of the most recently triggered traces.
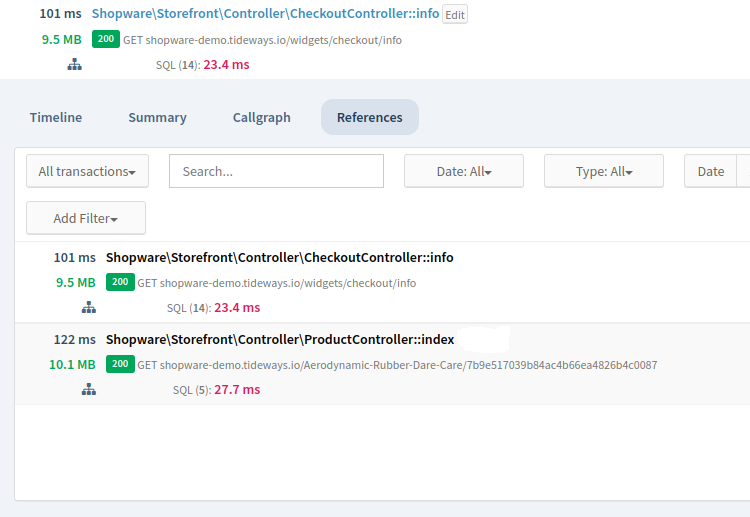
Navigating Referenced Traces
When looking at a trace inside Tideways UI that was triggered via Chrome Web Extension the "References" tab allows to see other related trace, for example related Ajax requests.