Transaction Failure Rates
| This feature is only available to non-legacy plans from 2023 and later. |
With the transaction failure rate alerting, you can receive notifications about individual transactions failing more often than a configured threshold.
The failure threshold configuration for each transaction is based on a list of pre-defined percentages and is configurable from the transaction settings page via bulk action or individually.
When Tideways detects an incident for a transaction, a notification can be sent to all of our supported integrations.
In case a system fails catastrophically, the failure rate of many transactions will be above their configured threshold. To avoid getting a notification for each of them, Tideways detects a system-wide failure and only sends one notification per service when 10 or more transactions are failing.
Configuration
-
Open the Notifications settings screen in your project
-
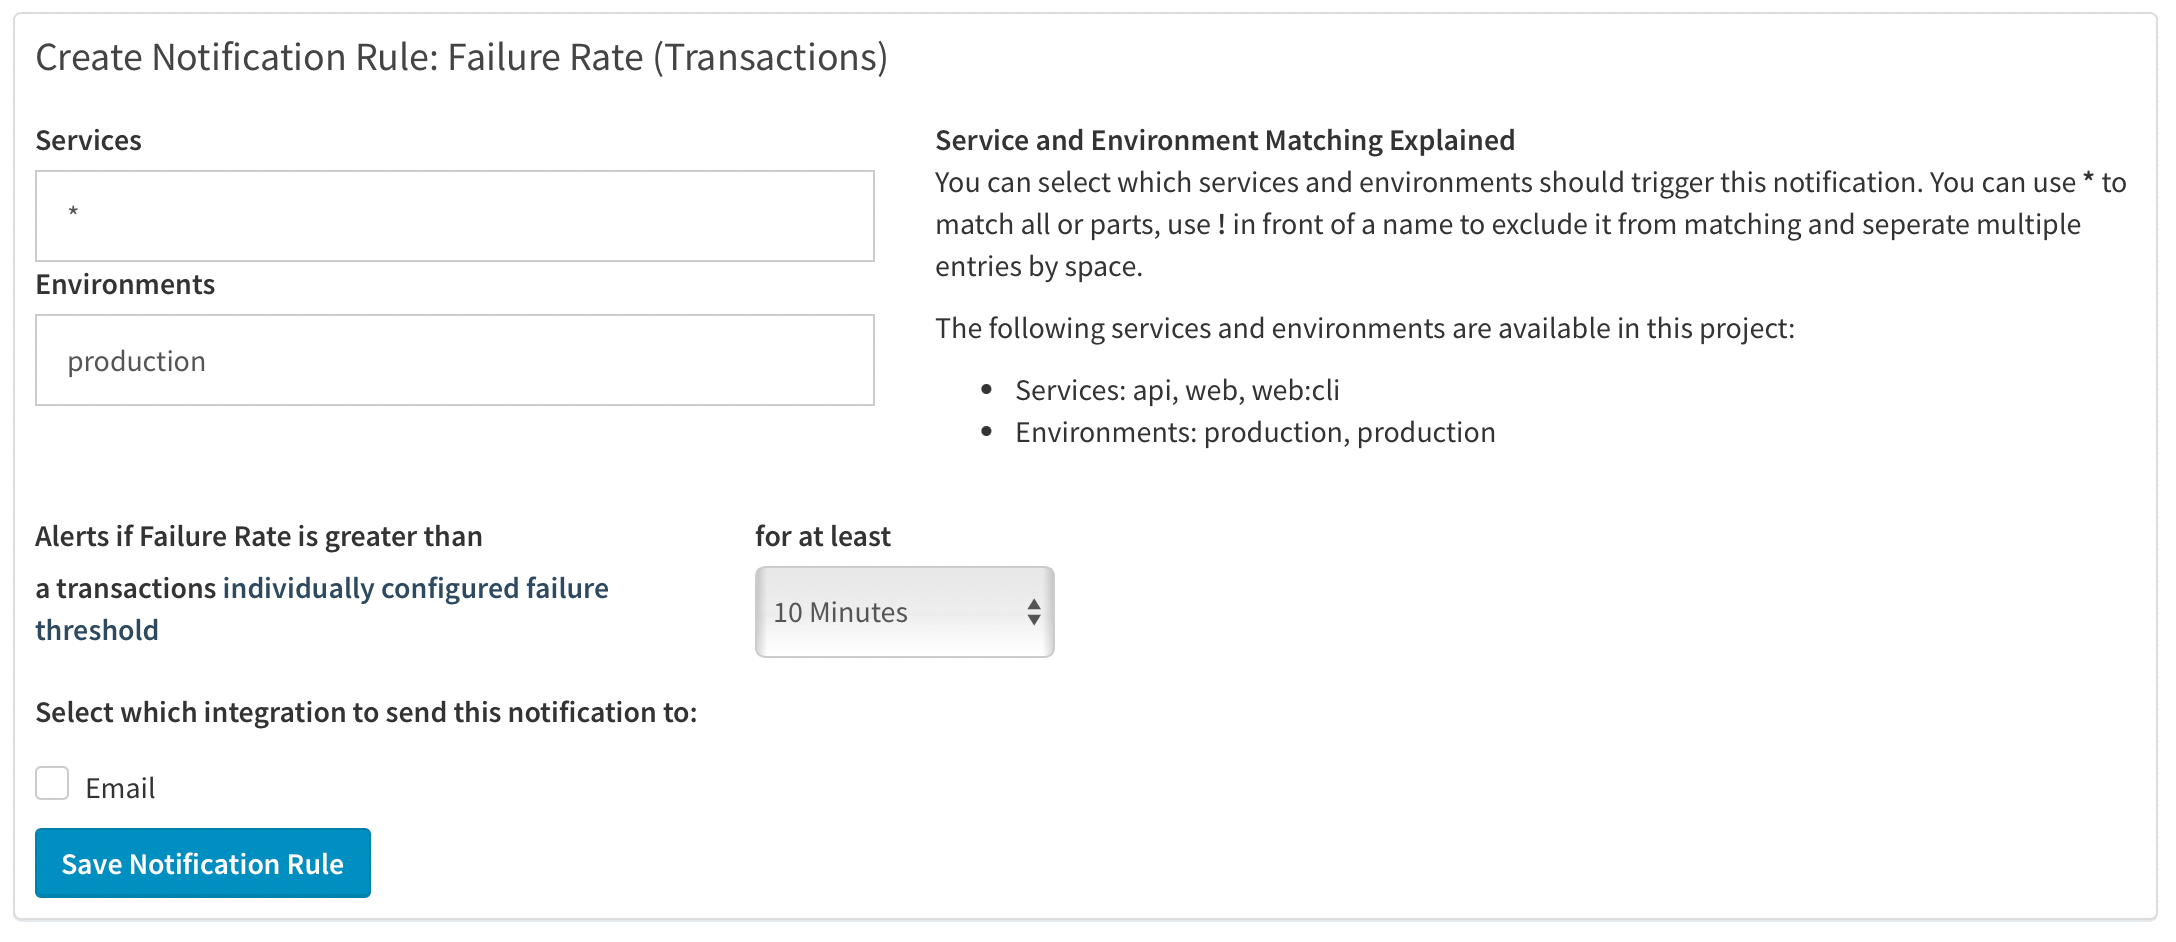
Click "Create Notification Rule" and select "Failure Rate (Transactions)"
-
Select Services and Environments to match the alert notification rule. By default all services of the production environment match.
-
Configure the length of the period that the failure rate should be checked for. For example 10 minutes. This applies to all the transactions and should only be set to a low value below 60 or 30 minutes for projects with high traffic on all transactions.
-
Select the integrations to send a notification in case an incident is created.
-
Save the Notification Rule.
-
Open the "Transactions" settings screen and configure the failure threshold for all important transactions that you want to monitor closely. Only transactions with configured threshold are considered.
View Active and Resolved Incidents
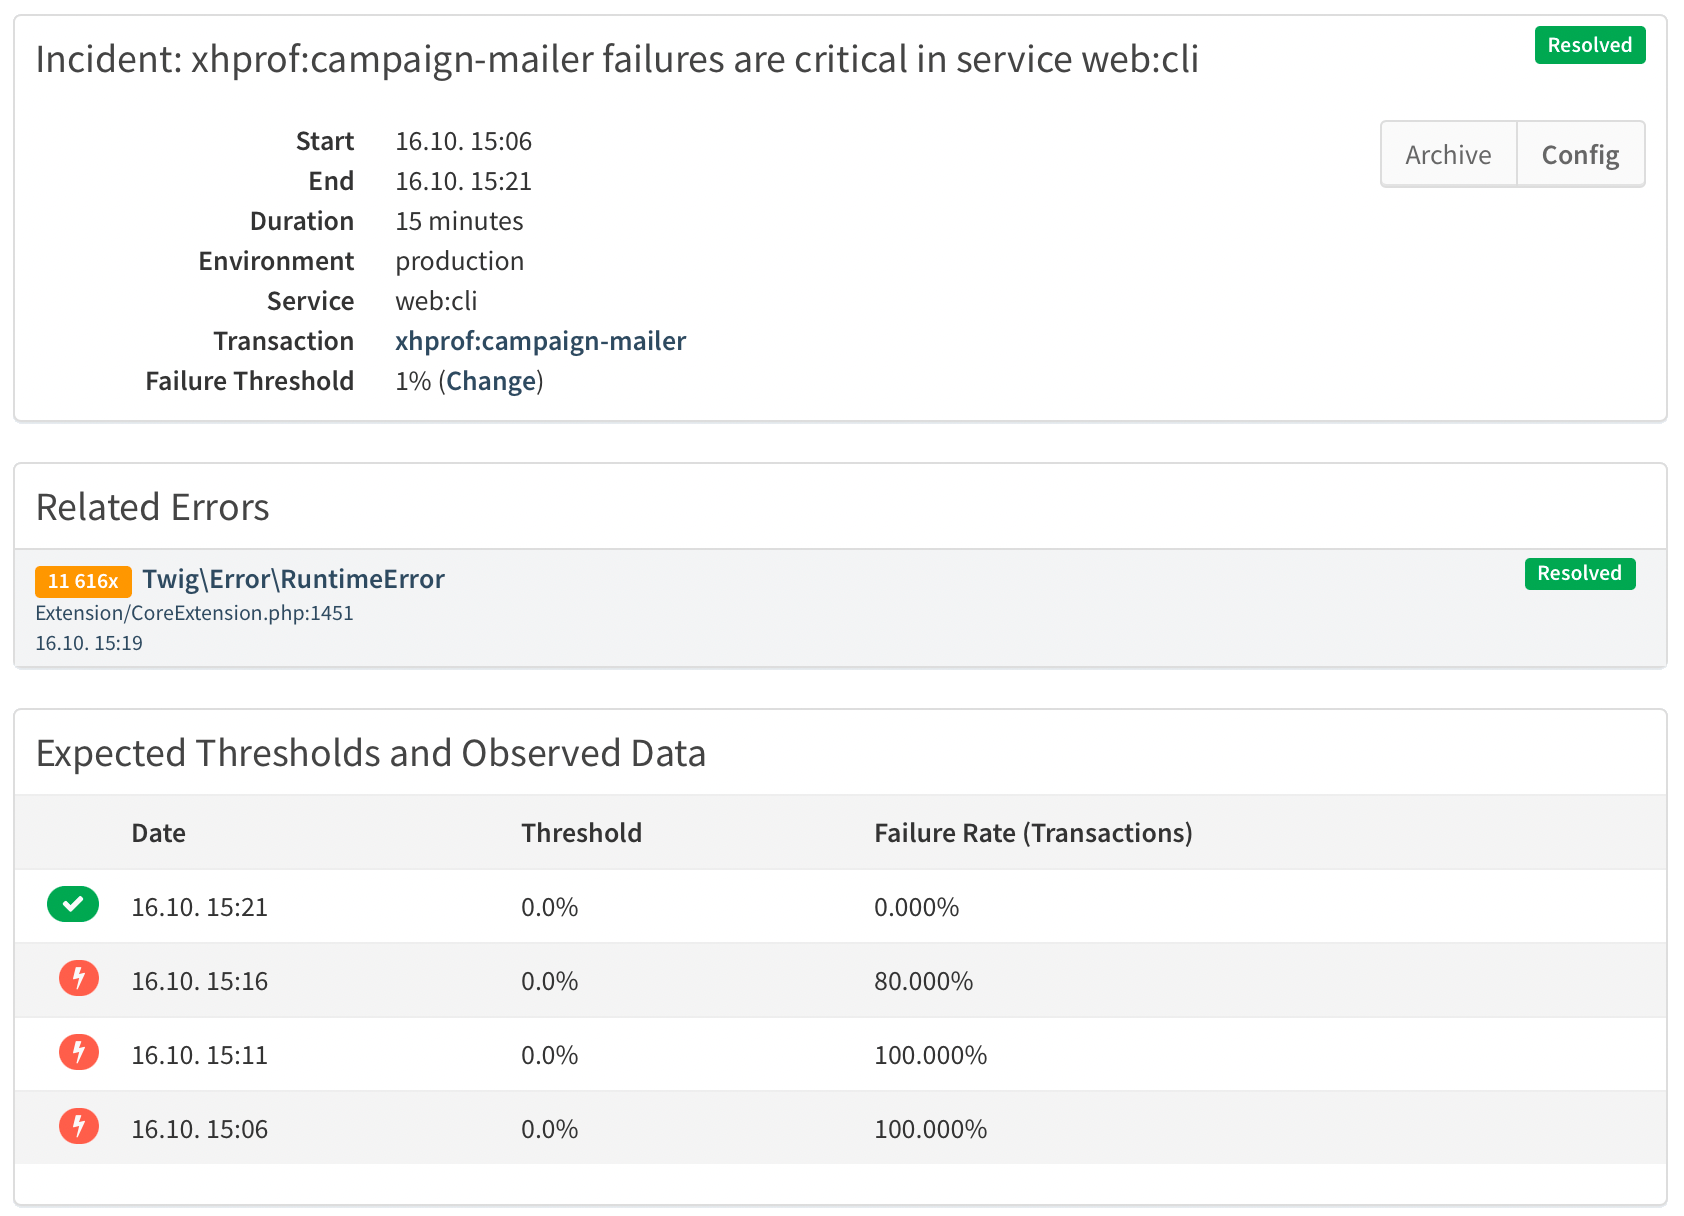
To see a list and details of each incident created by the transaction failure rate notification rule, open the "Issues" section in your project and select "Incidents".
This shows a list of all open incidents in the currently active service and environment. You can switch services or environments and change the status filter to see all or only resolved incidents.
The details of a transaction failure rate incident include information about the threshold, the observed values, the duration of the incident and a list of related errors or exceptions.
Related
-
Configure Response Time Targets to turn slow requests into failed requests.