Enable Callgraph and Timeline
| These methods are only available with Tideways Extension Version 5.0.46 and higher. Please upgrade the extension to the latest version before using this API. |
When you are debugging performance problems a full call graph of all function calls can give you more detailed insights then a regular timeline trace. If you want to trigger a call graph for a select operation in your application code, then you can trigger it with this following Extension-API-Call:
<?php

if (class_exists('Tideways\Profiler')) {
    \Tideways\Profiler::enableCallgraphProfiler();
}
The call graph profiler can only be activated when Tideways is sampling the request, that means a regular trace is already active and collecting spans for the timeline and flame graph profiler.
If you want to guarantee the call graph profiler is activated via the previous API call, then you can also force the tracing profiler to start, which is a programmatic way of setting the sampling rate to 100%:
<?php

if (class_exists('Tideways\Profiler')) {
    \Tideways\Profiler::enableTracingProfiler();
}| When starting the tracing profiler spans for already running functions are not created anymore. This includes for example framework spans such as "Symfony", "Wordpress" or "Shopware" or controller spans. |
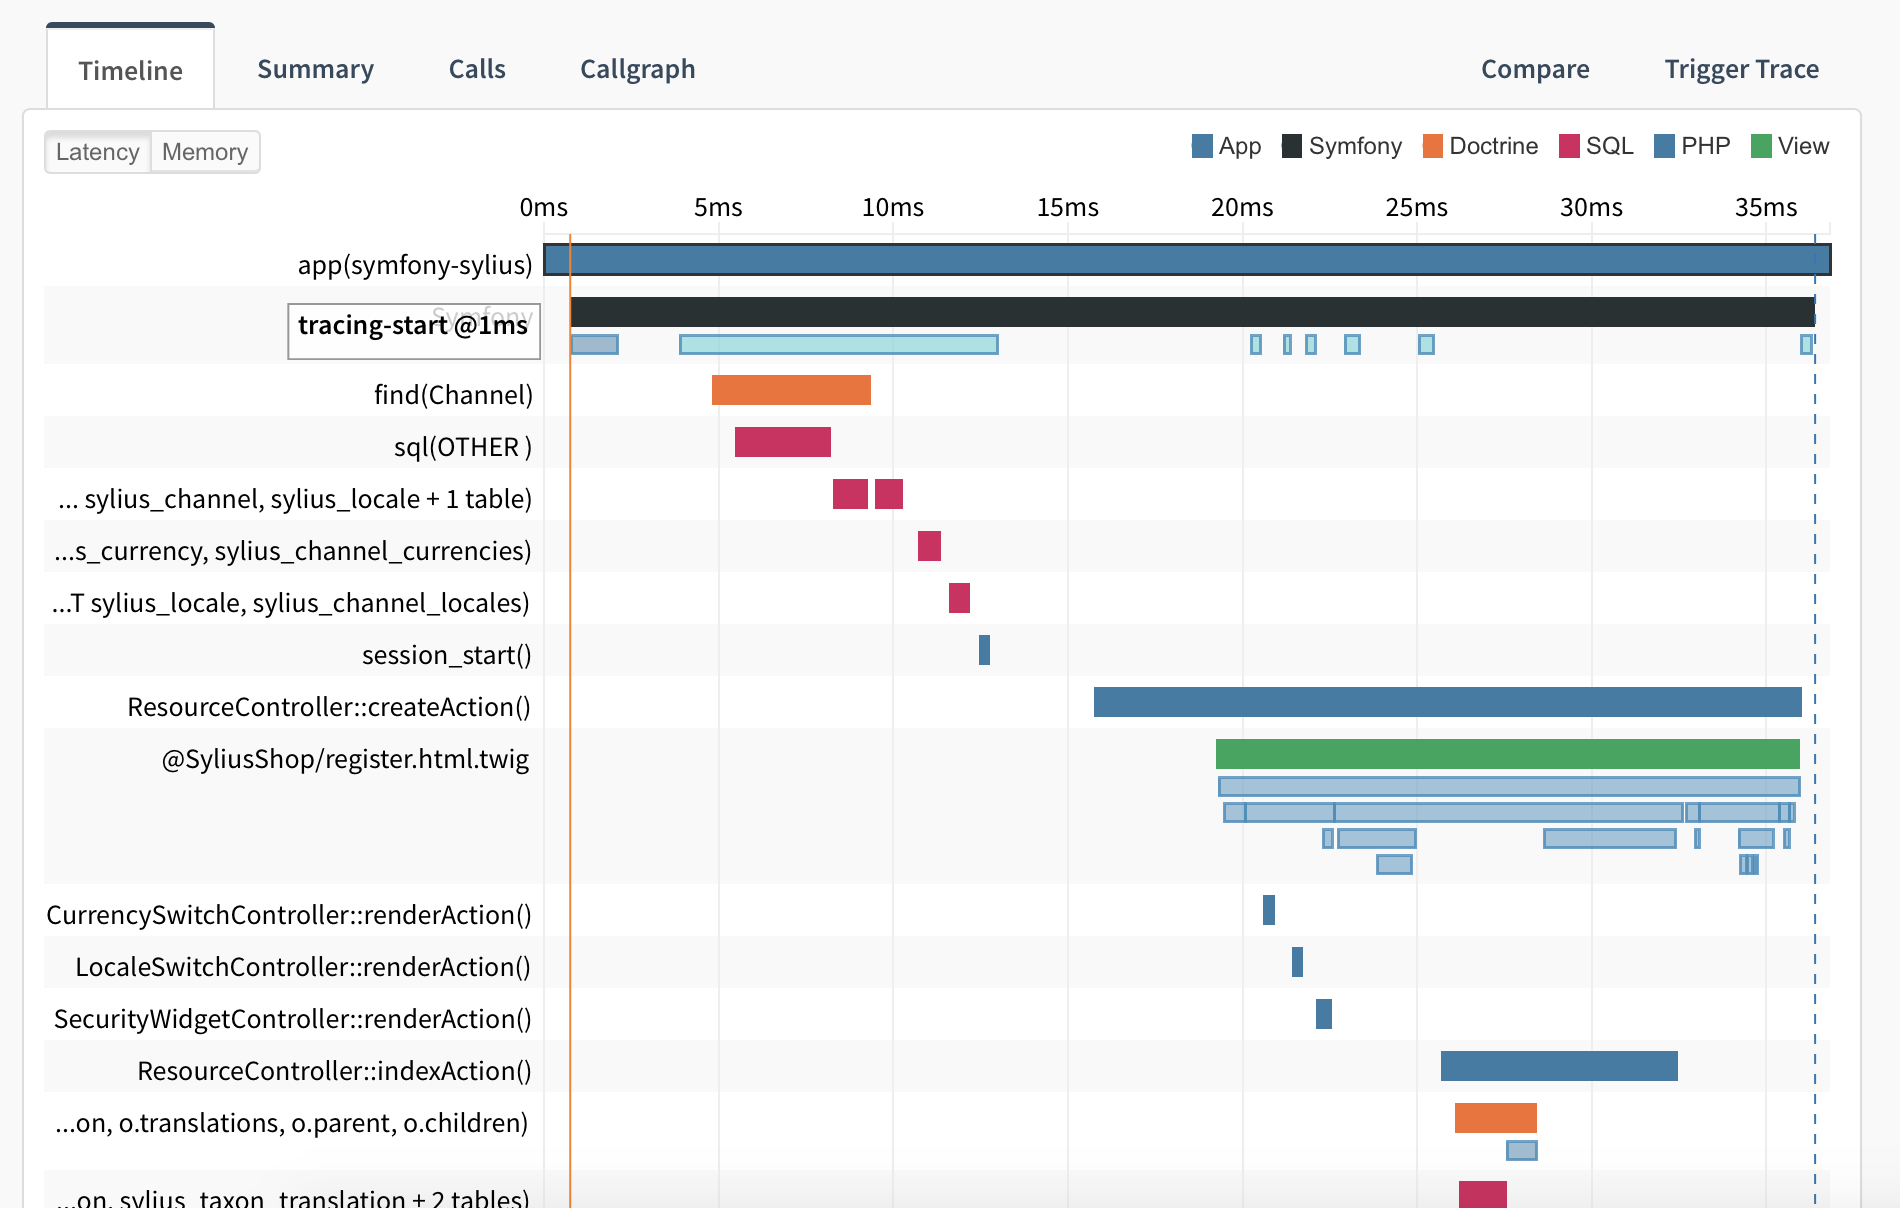
The request of your application was already running until you enabled tracing or call graph profiling. To see when in your request the Profiler was started, the timeline shows a 'tracing-start' event marker. The timeline should be mostly empty on the left side of this marker, because the instrumentation was only activated afterwards.
