Find Traces
Traces are detailed breakdowns of the performance of requests in your project. They are collected at random via the configured sample rate as well as when a developer triggers them manually.
There are two ways to find interesting traces to identify bottlenecks or start improvements:
-
Dive into a transaction in the list of transactions on the main project screen, to immediately see a list of recent traces that were collected for this transaction
-
Select one of your manually triggered traces directly in the "My Callgraph Traces" box on the main project screen, or click All Traces, for a list of all traces collected in the project.
Traces for a Transaction
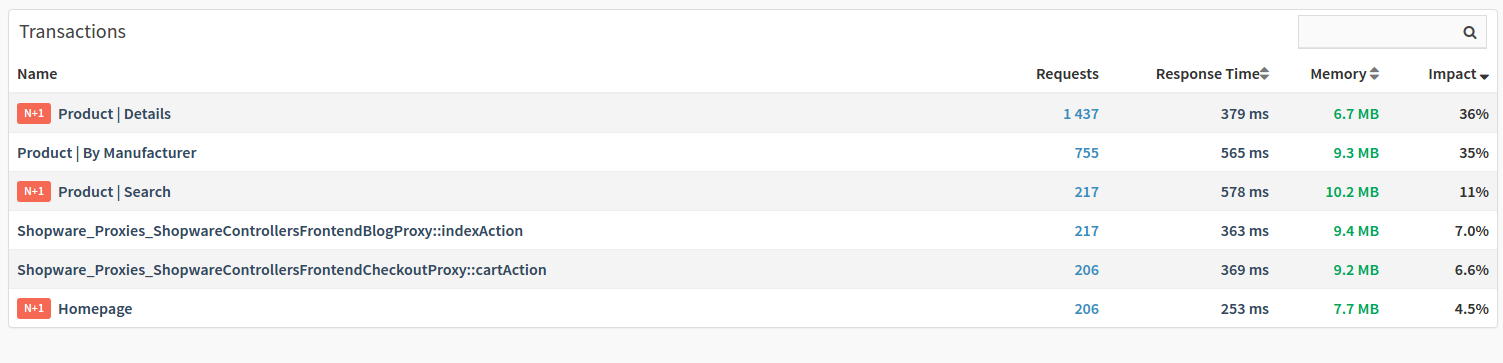
If you monitor your project with Tideways in production, traces are collected for every individual transaction regularly and automatically. Start on the main screen to pick the transaction you want to investigate in detail:
On the transaction details screen, you can then scroll to the bottom to see the "Profiling Traces" box with all the recently collected traces:
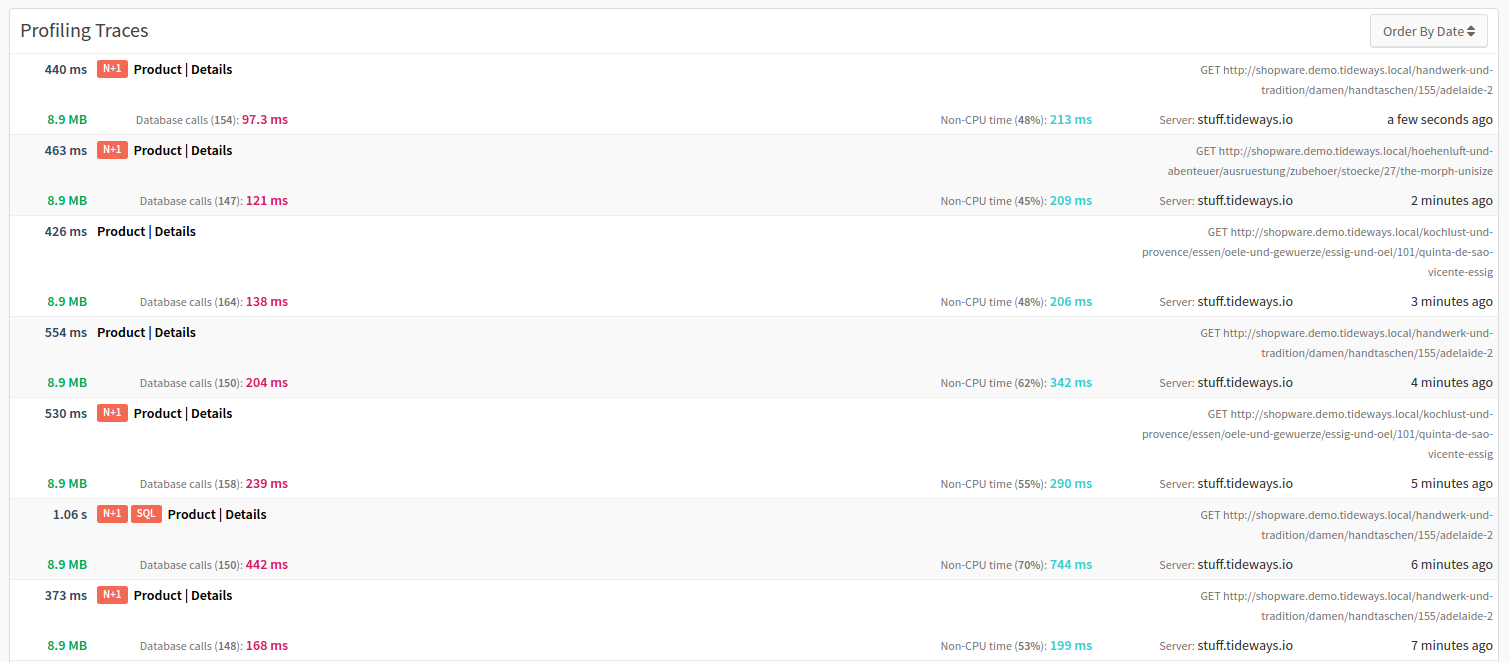
Then, select a trace and continue to anTlyze the trace.
List of All Traces
The second way involves the "My Callgraph Traces" box on the main project screen. It shows a list of all the traces that you have triggered manually in the selected date range. You can directly pick one of the traces to jump to its details:

If you want to search and filter for trace details click All Traces to find a list sorted by the most recently collected traces.
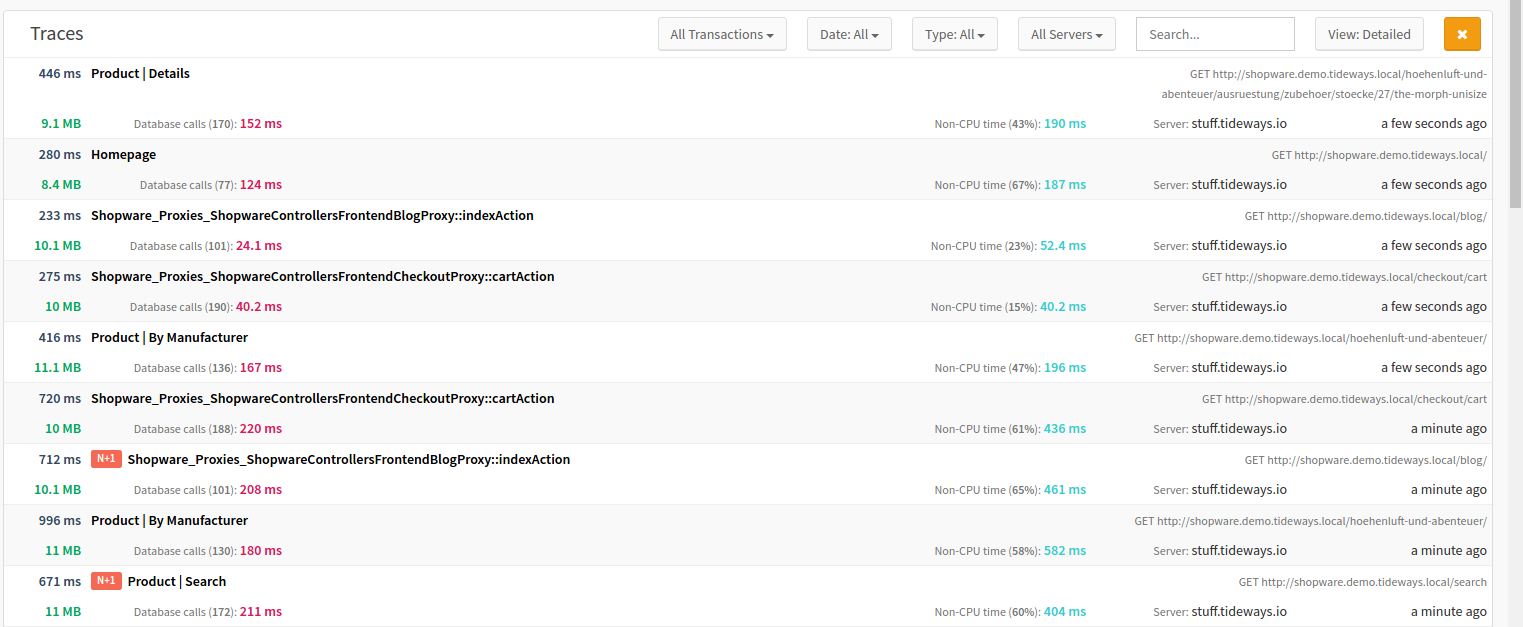
You can filter traces by transaction, server, and detail type (trace or callgraph), and search for parts of the URL or transaction name.