4. The Timeline Profiler
Introduction
So, what is the Timeline profiler? This Timeline profiler collects information about a range of operations performed by your application.
The Timeline Profiler collects several interesting operations for each trace and makes them available in a time-based view, or representation, from 0ms to the end of the request. These operations include, but are not limited to, SQL statements, controller calls, and template rendering.
Having this kind of information available helps you quickly get a thorough understanding of how your application is performing, what it is doing, and where the bottlenecks are. With that information available, you can focus on fixing the bottlenecks and making your application perform optimally.
There’s no need to waste time, resources, and effort on guessing where the problems are and, ultimately, doing premature optimization. To drive the point home, Donald Knuth, in his famous book The Art of Computer Programming, said:
Premature optimization is the root of all evil (or at least most of it) in programming.
The Art of Computer Programming
The Timeline Profiler
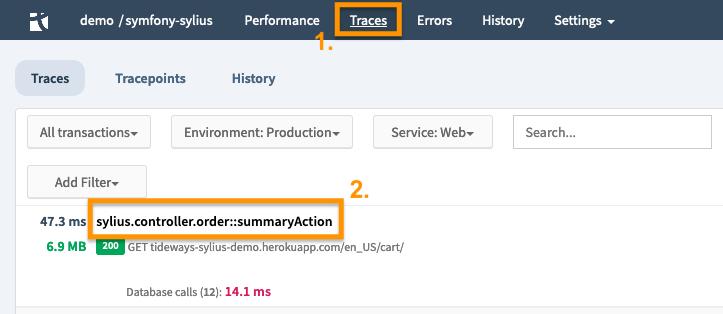
To get to the Timeline Profiler, open the Traces screen by clicking Traces, in the top-level navigation bar <1>. There, you can see a list of all incoming traces from the most to least recent. By clicking on the transaction name of any one of the Traces in the list <2>, we’ll then see the Timeline Profiler for that trace.
|
You can also get to the Timeline Profiler from the Transactions list in the Performance view. After clicking on a transaction, scroll to the bottom of the page, where you see a list of traces. Click on a trace, and you’ll then see the Timeline Profiler for it. |
|
You can filter the available traces by environment, service, user, free-form search criteria, date, and type, amongst other criteria. |
The Timeline Header
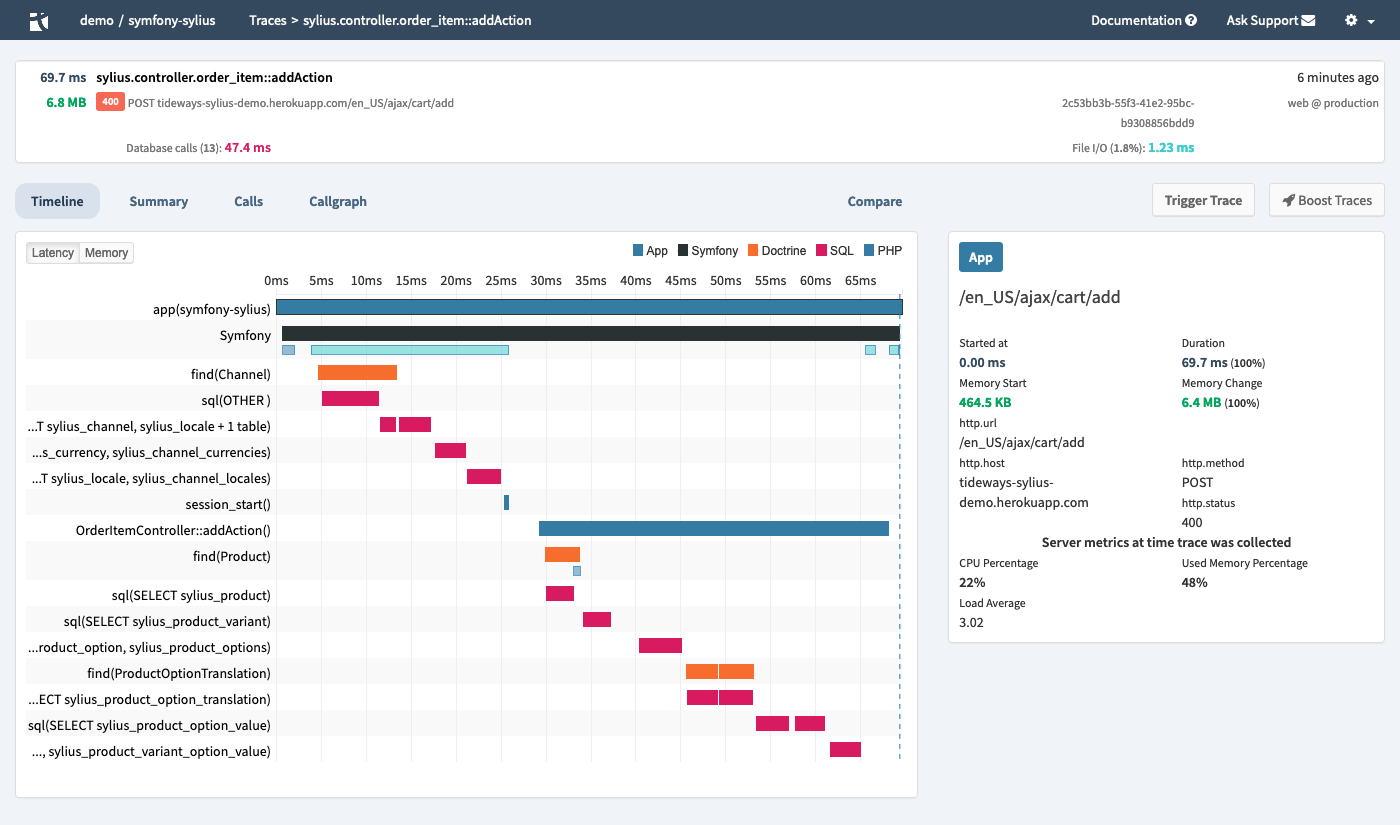
At the top of the page, we see the timeline’s header, which shows:
-
The request’s response time
-
The amount of memory the request used
-
The request’s URL
-
The transaction’s name
-
The status code of the response
-
Any error & exception classes
Also, the Timeline header shows the different layer which composed the operation, along with their execution times (or timespans) and how often they were called.
In this example, you can see that the response took 272 ms, consumed 6.5 MB of memory, and was executed 6 minutes ago.
The request returned an HTTP 200 OK response code, from the request to /en_US/cart/.
The request was handled by sylius.controller.order::summaryAction.
It has several layers, including one with Database calls and one for File I/O.
The Timeline in Detail
Underneath the Timeline header, we see the Timeline Profiler in complete detail. It is composed of five tabs: Timeline (the default), Summary, Calls, Callgraph, and Compare.
| The Callgraph tab is covered in the Callgraph Profiler. |
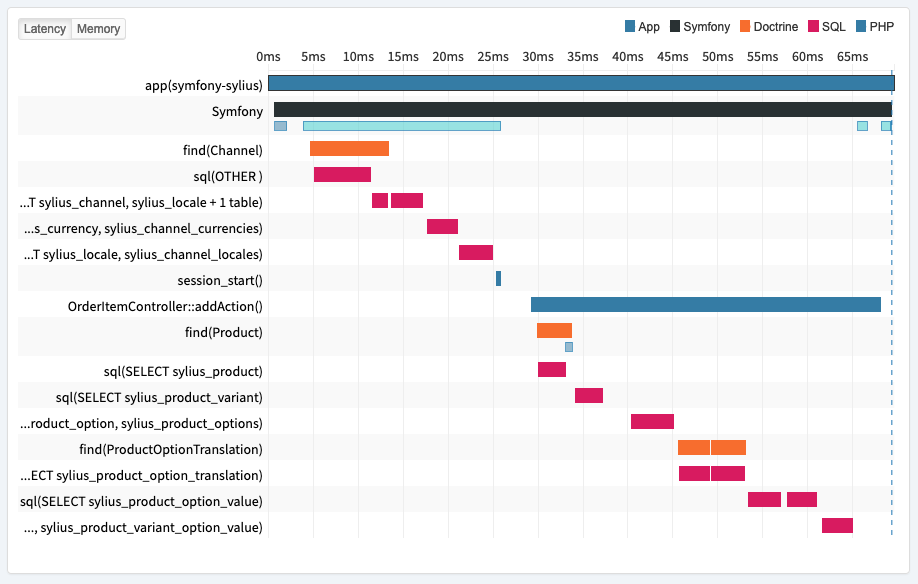
The Timeline Profiler is a very detailed graph, similar to what you might see when analyzing Xdebug results in KCacheGrind, WinCacheGrind, and WebGrind. It shows a breakdown of the request both by latency and by memory, with latency being the default.
Looking at this example, on the left, you can see all the function calls which composed the transaction, from earliest at the top, through to latest at the bottom, with one or more timespans for each one. Each of the timespans in the graph is color-coded based on its type (e.g., App, Symfony,Doctrine, SQL, and PHP), making them easier to visually distinguish from one another.
What is a Timespan?
Timespans are explicitly programmed instrumentation, in the Tideways PHP extension, for example, SQL via PDO, MySQLi, HTTP via file_get_contents or cURL, Symfony, Shopware, and Twig. Each timespan has a "Type", for example, SQL, HTTP, PHP, and MongoDB, and a color to make them easier to see recognise and distinguish from one another. And each type has different annotations, such as Query in SQL, and Method and URL in HTTP.
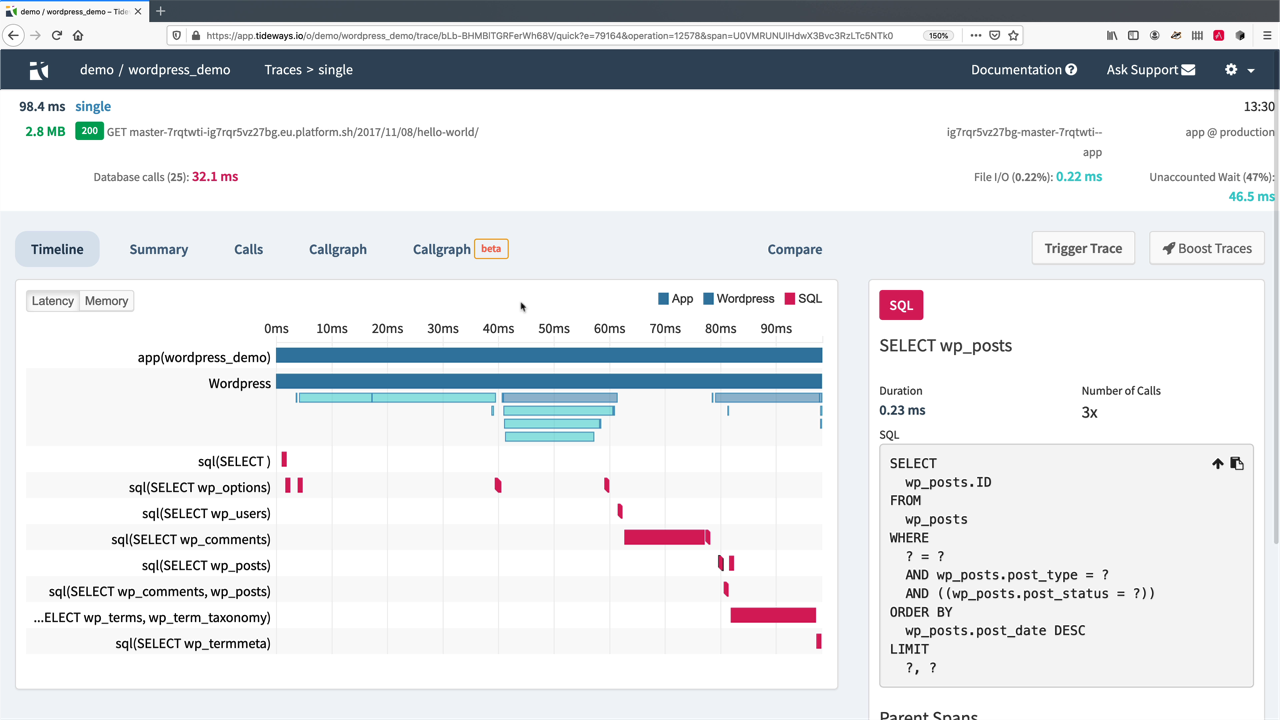
Certain timespans are batched into a single span, when they appear in short repetition and are short in duration (less than the slow request threshold), for example, 10 Memcache calls within 5ms, where each of them lasted not longer than 1ms. These are called batched spans. However, they also have less overhead in collection, so, potentially, many more of them can be collected. If you click an lightweight span it will be rendered below its parent span, on the right-hand side of the timeline2.
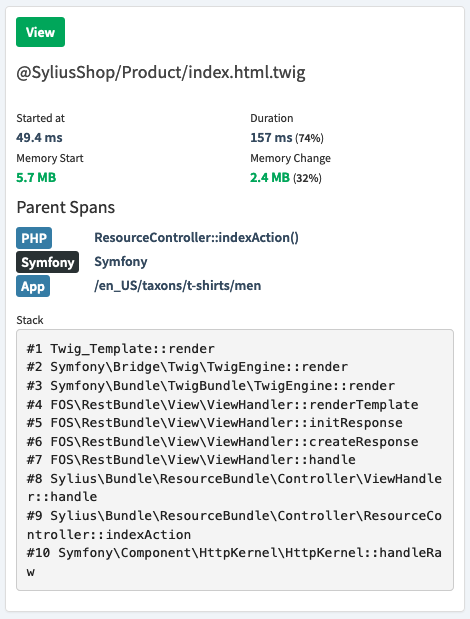
If you click on a timespan, you’ll see detailed information, particular to the request, on the right-hand side of the screen. Each one will list the following details:
-
When it started
-
Its duration
-
The memory usage when it started
-
The change in memory
-
Its parent span(s)
In addition, each span type has its own annotations. For example:
-
SQL spans show anonymized SQL queries
-
Template spans display the template name
-
HTTP spans contain the host, URL, and response codes; and
-
Doctrine timespans contain DQL queries
In addition to this:
-
All timespans will contain parent spans
-
All spans slower than 10 ms will have a stacktrace; and
-
Spans that take longer than the slow request threshold have the stack trace attached in the details pane on the right-hand side of the Timeline view.
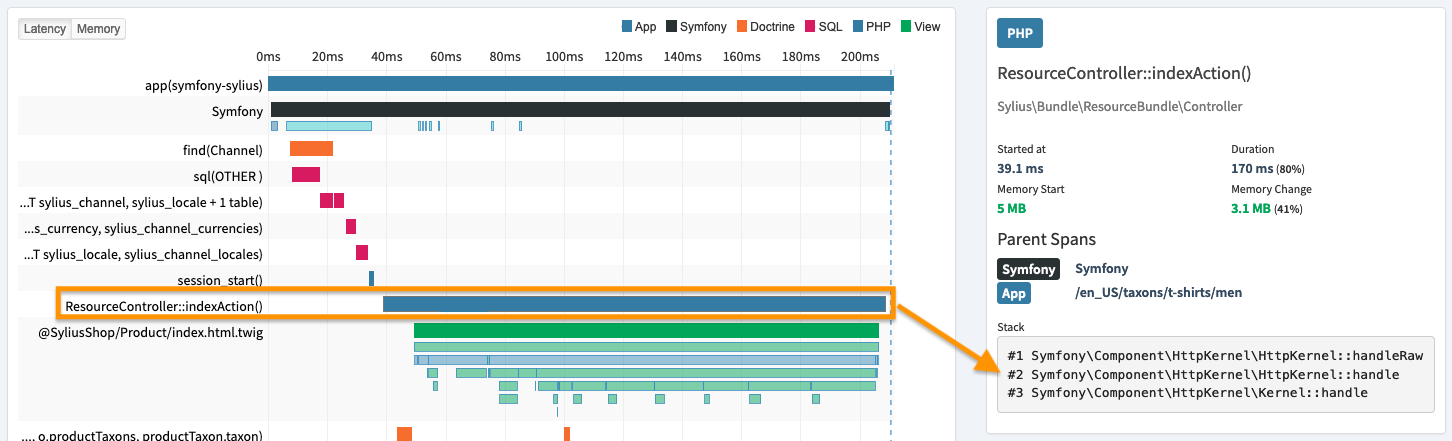
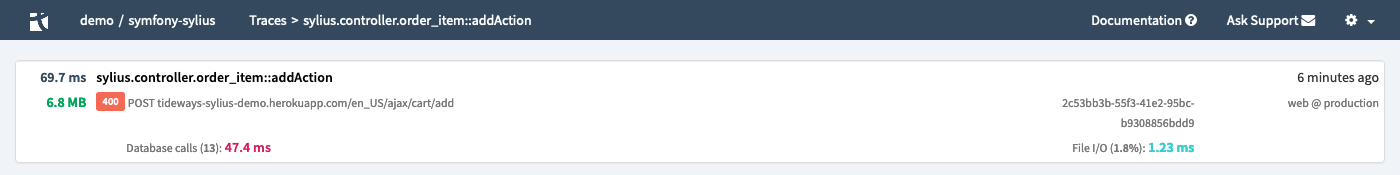
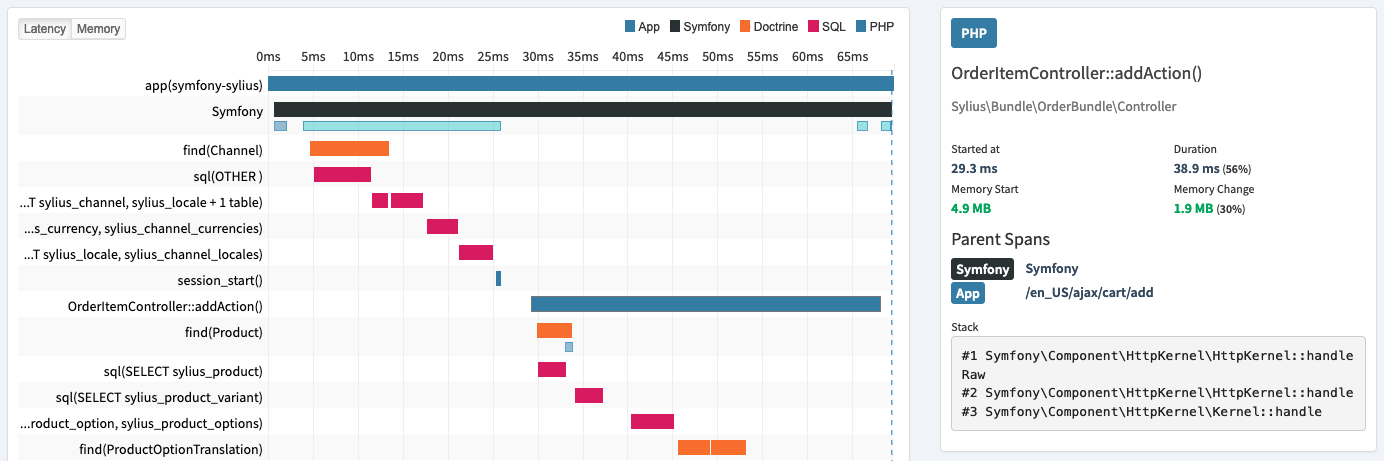
In the example above, you can see that the request took 170 ms and 5MB of memory.
We can see that the HTTP status returned was an HTTP 200 OK, and that it was handled by ResourceController::indexAction.
We can also see that it consumed 3.1 MB of memory.
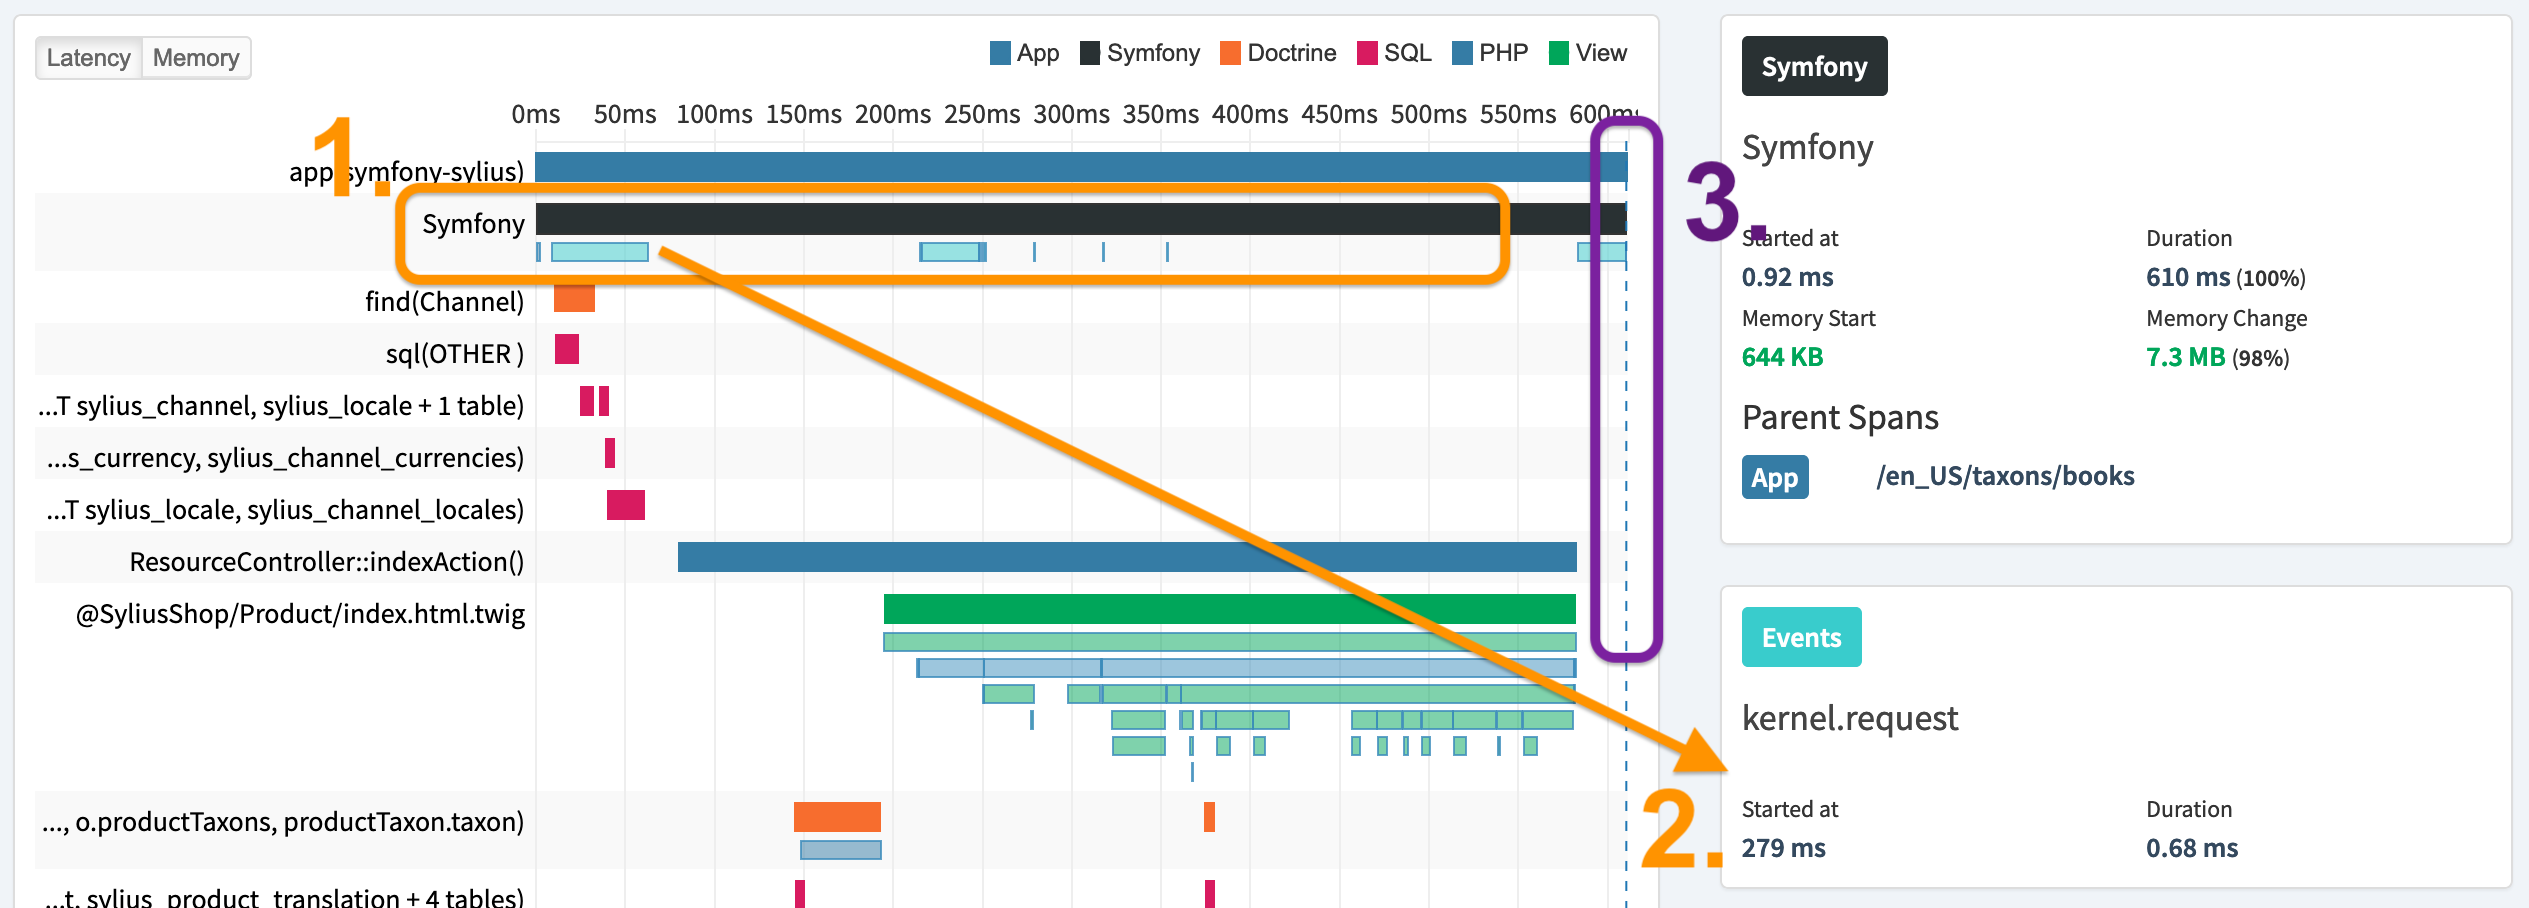
Two other points worth mentioning. Firstly, take a look at the black Symfony span on the second line1 in the above example. You can see that underneath it, there a number of smaller, light-blue spans. These are events that happen during the above, or parent span. These are lightweight spans, and contain fewer details than a parent span.
Secondly, on the far right of the timeline, you’ll see a vertical, dashed-blue, marker3. These come from function calls, such as fastcgi_finish_request, which occurs when PHP completes sending the headers and body back to the web server. They can also be manually triggered.
The Summary Mode
Next, let’s see look at the Summary mode. To do that, click the Summary tab. The summary screen presents the function calls in a tabular fashion. The table contains each item’s category, representative name, call count, and total duration and self duration in time and as a percentage of the overall request.
|
Self duration is the time spent directly in that function, and total duration is the time spent in that function — and in the functions which it called. |
The final three columns are sortable in both ascending and descending order. This helps to look at the request from a variety of perspectives, and let you make meaning from it quite quickly.
Conclusion
In this section, we gained a solid introduction to the Timeline Profiler. We saw the various components, including the header, timeline, summary, calls, and compare modes. If you’d like to know anything more about the Timeline Profiler, please check out the relevant documentation, starting from the Timeline Profiler.