5. The Callgraph Profiler
Introduction
The Callgraph Profiler shows how much time was spent in each function as well as any functions which it calls, as a call graph. When you are debugging performance problems, a full callgraph is compelling, as it can provide detailed insights into every function call of a PHP request.
Here’s why:
-
You can determine the functions which, as a result of the functions which they called, use unusual amounts of time.
-
Every function call during a request is listed with inclusive and exclusive wall-time and call counts.
-
You can group and filter function calls by namespaces of your code and all the libraries that it uses.
-
You can compare profiles to find the cause of performance regressions and see your progress when improving code step-by-step.
When you are debugging performance problems, a full callgraph can give you more detailed insights into every function call of your PHP requests.
|
Please be aware that, because the Callgraph Profiler has a noticeable overhead over the Timeline Profiler, it is only available for traces with a manually triggered or requested via a tracepoint. We’re not going to do that in this chapter, as doing so is covered in the following chapters:
That said, the examples in this chapter assume that one has already been triggered. |
Using the Callgraph Profiler
To view the Callgraph Profiler, click the Callgraph [beta] tab in a trace with a callgraph trigger for it. When there, you’ll see that the profiler is composed of four parts, these are:
Let’s explore each one in turn.
The Call Information Table
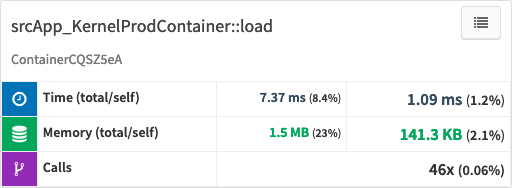
The call information table is a summary table of a function call selected in [the Calls Table]. As different functions are selected in the Calls Table, the information in this table changes. For a selected function, it lists three things; these are:
-
The Total- and Self-time
-
The Total- and Self-memory usage
-
The number of functions which it called
In this example, you can see that for the call to UnitOfWork::createEntity:
-
The total time was 17.8 milliseconds (12% of the total request)
-
The self-time was 10.5 milliseconds (7% of the total request)
-
The total memory used was 662.1 KB (7.9% of the total request)
-
The self memory used was 194.1 KB (2.3% of the total request)
-
And, the function was, itself, called 146 times
The Calls Table
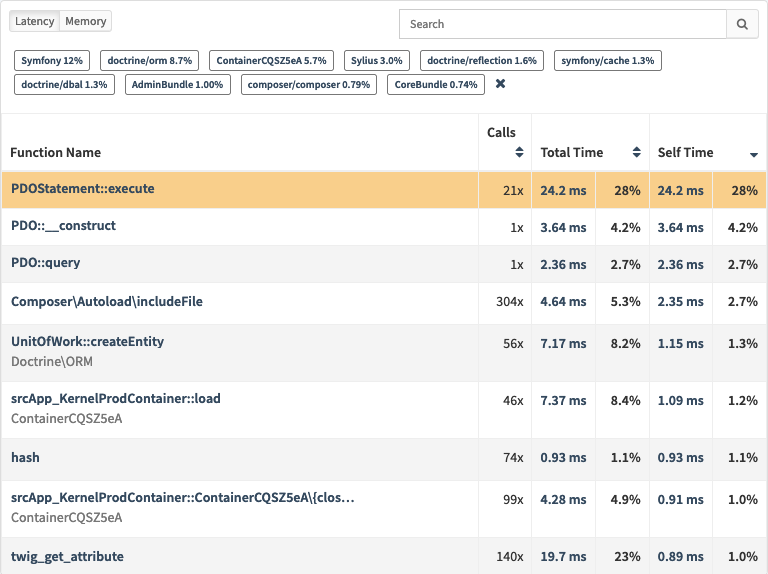
The Calls Table lists all of the functions called by the transaction. It displays the information in two ways, by latency (the default) and by memory usage.
The latency view of the table lists:
-
The function’s name
-
The number of times the function was called
-
The Total-time in milliseconds and as a percentage of the transaction’s time
-
The Self-time in milliseconds and as a percentage of the transaction’s time
The memory view of the table lists:
-
The function’s name
-
The number of times the function was called
-
The Total-memory and Self-memory in megabytes and as a percentage of the transaction’s memory usage
The latency view sorts the table by the highest Self Time. This is the slowest function of the request and often the main bottleneck. The memory view sorts the table by the highest Self Memory. To change the sort order, click the up or down arrow, where applicable, next to the column name which you want to sort by.
| The table is sortable by Calls, Total Time, Self Time, Total Memory, and Self Memory, not the function’s name. |
Each time a function in the Calls Table is selected (denoted by a thick, dark blue left-hand border), the Call Information Table, the Parent Calls, Child Calls, and Slowest Code Path, and the Callgraph View change to center themselves around that function.
Filtering Table Data
The table supports the ability to filter the information displayed by name, namespace, and Composer package.
| For specific frameworks (currently Symfony and Shopware) and applications grouping by plugin, bundle, and module, etc, is also supported. |
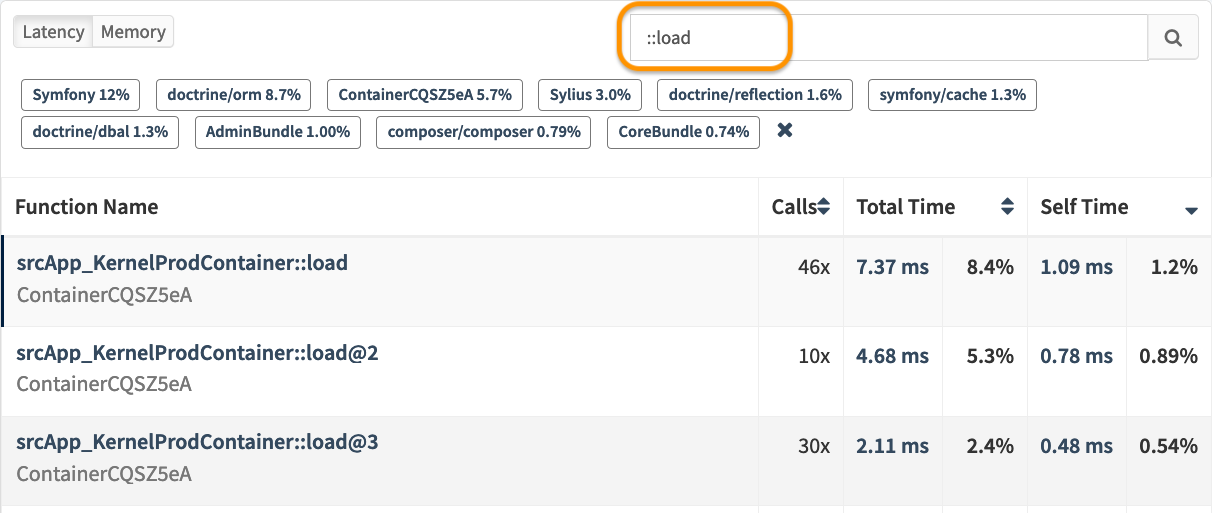
To filter function calls by name, type the function’s name, or a part of it, in the search field on the top right-hand side of the table. As you type the function’s name or part thereof, the list of functions displayed reduces until only those matching the search string, if any, are displayed.
In this example, you can see that the list has been filtered to only those functions that include ::load in their name.
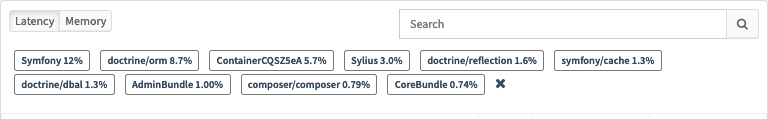
To filter by namespace and Composer package, click one or more of the pre-defined options between the search field and the table.
In this example, you can see that the list has been filtered to display only those functions in the Symfony and Sylius namespaces as well, as the doctrine/reflection and symfony/cache Composer packages.
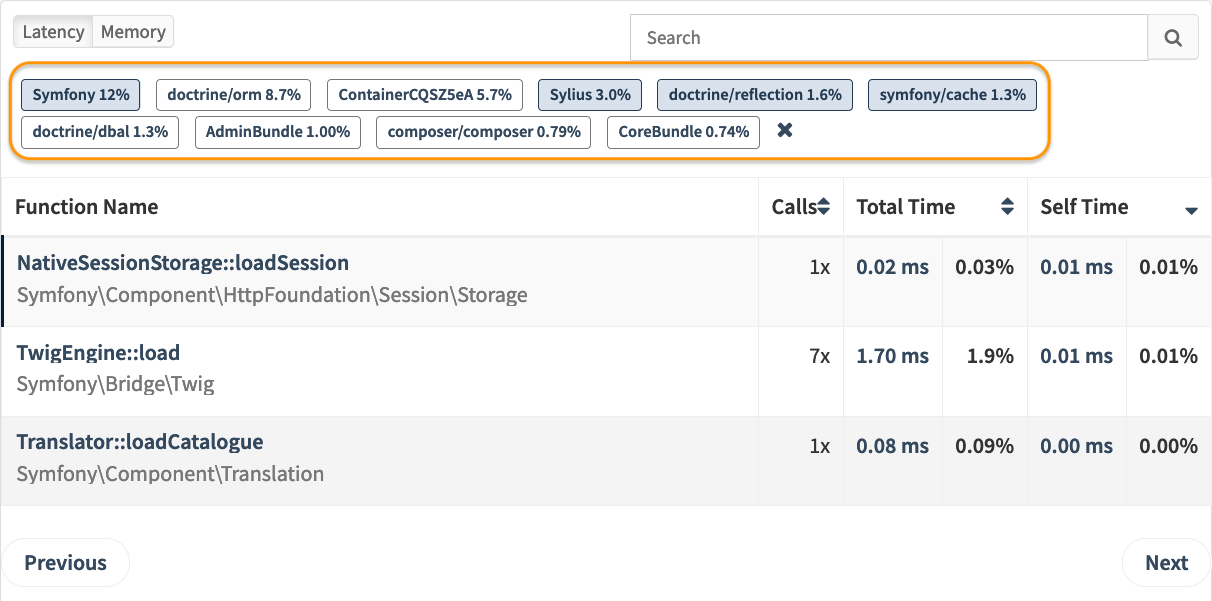
| To quickly clear the filter criteria, click the cross icon. |
The Parent Calls, Child Calls, and Slowest Code Path
This view, as the name implies, shows for the current function, its parent function, any functions it called, and the slowest code path for it. For each one, it displays the number of times it was called, the total time, and total percentage.
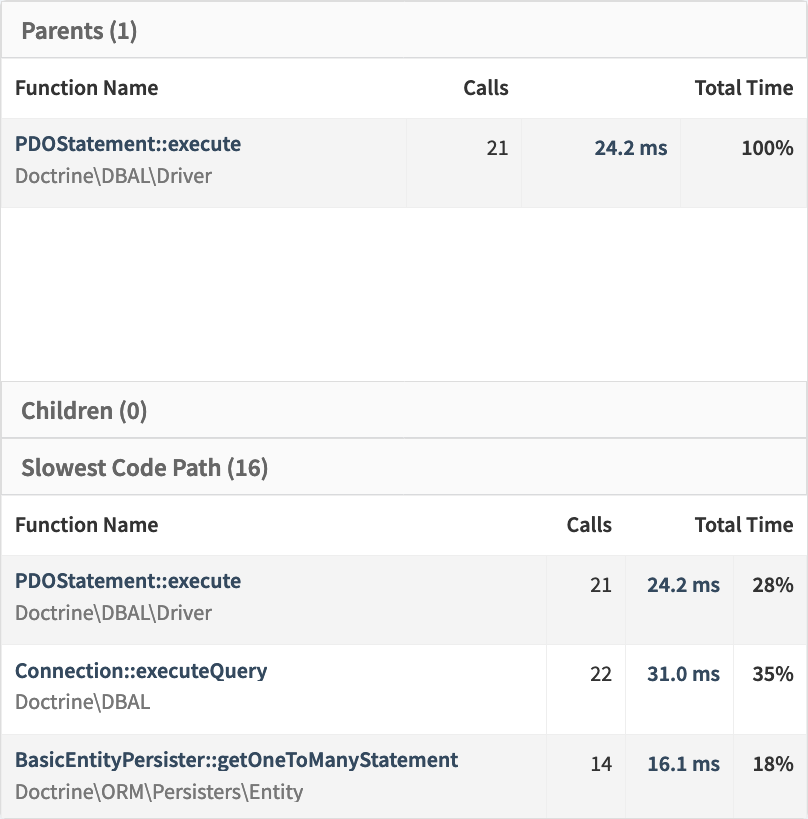
In this example, the UnitOfWork::createEntity function is selected.
You can see that it has:
-
Two parent functions:
ObjectHydrator::getEntityandSimpleObjectHydrator::hydrateRowData -
Sixteen child functions, including
UnitOfwork::loadCollection,EntityManager::getClassMetadata, andUnitOfWork::newInstance -
Sixteen slow code paths, including
AbstractLazyCollection::countandPersistentCollection::count
As with the Calls Table and the Calls Information Table, you can select any function in each of the three sections, and that function becomes the function in focus. A handy feature of this view is that each of the three sections can be compacted and individually displayed. That way, you can focus on just what you need and hide the rest away until you need to see it.
The Callgraph View
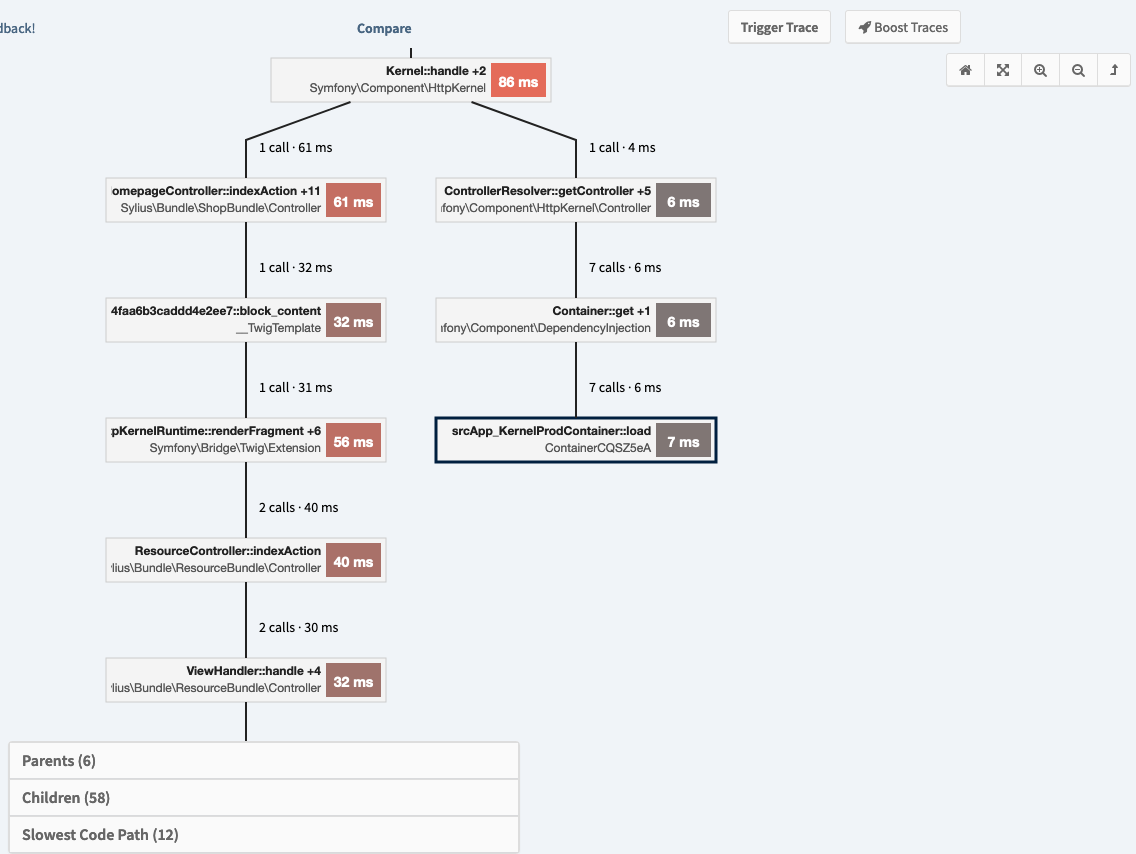
The Callgraph View shows the function calls as a call graph. Specifically, it shows:
-
Call Times: these are the time taken for every function or method to execute
-
Call Counts: these are the number of times a routine was executed; and
-
Call Chains: these are the path to/from a routine
Initially, the callgraph view shows three hot paths.
By default, these are for the 3 functions that have the highest Self-time, going upwards from them until main() is reached.
When you click a function in the Calls table that is not part of the currently rendered Callgraph, then a fourth hot path from that function is added, so the function becomes visible in the graph.
To help make navigating through the available information more efficient, it provides a series of controls. There are five buttons:
-
The home button and return to main buttons which center the graph on the
mainfunction -
The show complete graph button, which zooms out until the entire graph can be viewed
-
The zoom out and zoom in buttons, which zoom out and in on a particular point in the graph. If you are using an Apple Magic Pad, zoom in using a two-finger downward drag and zoom out using a two-finger upward drag. If you have a wheel mouse, zoom in by scrolling down and zoom out by scrolling up.
| You can click and drag, or perform a three-finger move, to move the call graph around. |
By clicking on "Callgraph" in a trace, you can see the callgraph from top-down, following the hot path. Alternatively, you can click on the small call graph symbols in the call details panel, to see the callgraph with both children and parent functions for the selected call.
Each node in the graph lists:
-
The function’s name
-
Any folded function calls. Callgraph nodes are aggregated (or folded) when their total time is almost identical. You can view a list of the folded function calls by clicking "+n folded calls" in the Call Information Table when that function is selected.
The callgraph uses folding to avoid being unnecessarily large, thereby keeping the displayed information as concise as possible.
-
The total time or total memory, depending on the current view of the Call Table.
Summary
And that’s what the Callgraph Profiler is and how to use it to help improve the performance of your applications. We learned about its four parts, the Calls Information Table, the Calls Table, the Parent/Child/Slowest Code Path view, and the Callgraph view.
We saw how each component of the view is interlinked and changes each time a different function is selected. We saw how to navigate throughout each component along with the information which each component provides.