7. Using the Chrome Extension to Get Callgraphs
Introduction
In this section, we’re going to learn how to use the Tideways Google Chrome extension to get callgraphs.
Install the Google Chrome Extension
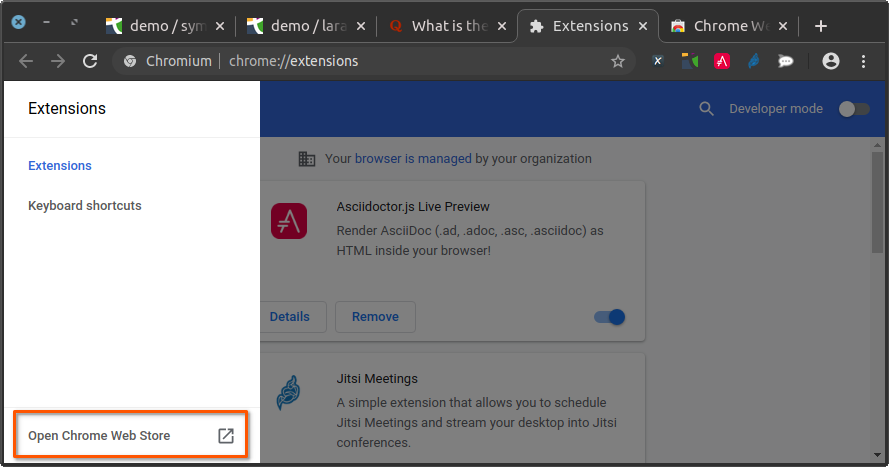
If you don’t have the Google Chrome extension installed already, let’s step through installing it. Click the "Customize and control" icon up in the top right-hand of the Chrome window (it’s the one with the three vertical dots) and then click menu:[More tools > Extensions].
Alternatively, open chrome://extensions in the address bar, if you’re a power user.
Either way, once there, click the main menu, on the top left-hand side of the Chrome window, next to "Extensions", it’s the icon with three horizontal lines, and click Open Chrome Web Store at the bottom left-hand side of the page, which takes you to the Chrome Web Store.
| You can also open https://chrome.google.com/webstore/category/extensions in your browser, and save yourself several steps. |
When there, search for "Tideways Profiler" in the "Search the store" field. This displays one result, which is the Tideways Profiler extension.
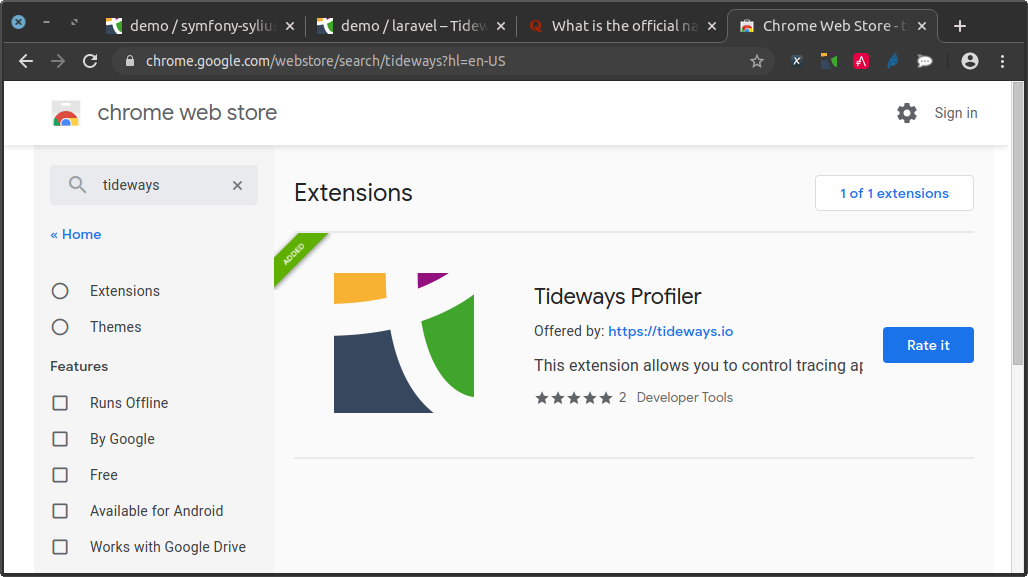
Click Add to Chrome, and then confirm installation of the extension, by clicking Add extension. After a short while, the extension will be installed and visible in the Chrome Menu.
Required Google Chrome Permissions
The Tideways Google Chrome extension requires the following permissions:
- Cookies for all domains
-
This sets the
TIDEWAYS_SESSIONcookie with a cryptographic hash which triggers the profiling, when found and verified, by the Tideways PHP extension. The extension only reads theTIDEWAYS_SESSIONcookie and doesn’t access other cookies. The alternative implementation would have been to requestwebRequestpermissions, which would give the extension access to all request and response data inside of Google Chrome. - Active Tab permission
-
This is used to access the location/URL of the currently selected tab when pressing the Tideways extension browser action button. The extension uses it to find out about the current URL and host so that it can preselect the correct Tideways application for profiling, and to reload the active tab when activating profiling.
None of the cookie or active tab data is sent back to Tideways servers. All calculations based on this data are performed inside the Google Chrome extension.
How The Google Chrome Extension Works
Profiling through the Google Chrome extension sets a cookie with a short expiry for the domain you are currently visiting. The cookie contains profiling instructions and a cryptographic signature, which the server with the Tideways PHP extension verifies, using the secret API Key using a strong HMAC (Hash-based Message Authentication Code) as a security mechanism.
The Google Chrome extension uses your current login to Tideways to request a hash that is valid for a short amount of time and stores this inside the cookie. Hashes are only valid for a short time, and the Google Chrome extension never stores secrets.
Using the Google Chrome Extension
With the Google Chrome extension installed (and enabled), let’s use it to generate a trace. To do so, you first have to be logged in to the profiler. You’ll know if you’re logged in or not because when you click the Tideways extension icon, it will display a popup that says, "You are not logged into the Tideways Profiler." with a Login button underneath the message.
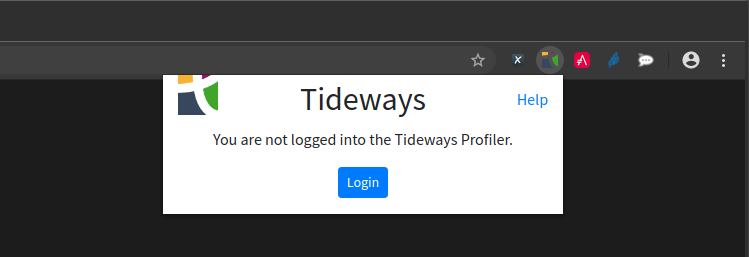
Click Login to go to the Tideways login page. There, enter your email (or username) and your password and click Log in. Now you are logged in.
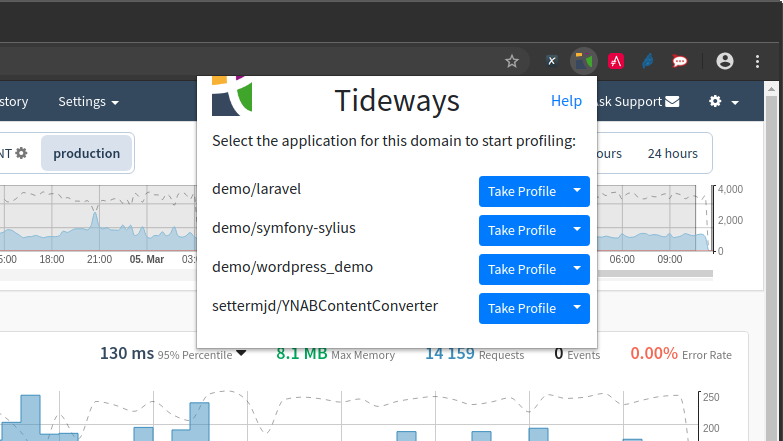
If you click the Tideways extension icon again, you will see a shortlist of applications for your domain, which you can start profiling.
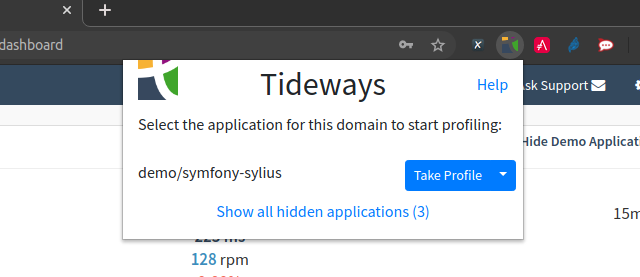
Some of your applications may be hidden, identified by text similar to the following, "Show all hidden applications (3)", which you can see the screenshot above. Clicking that text will display all of your available applications.
Profiling An Application
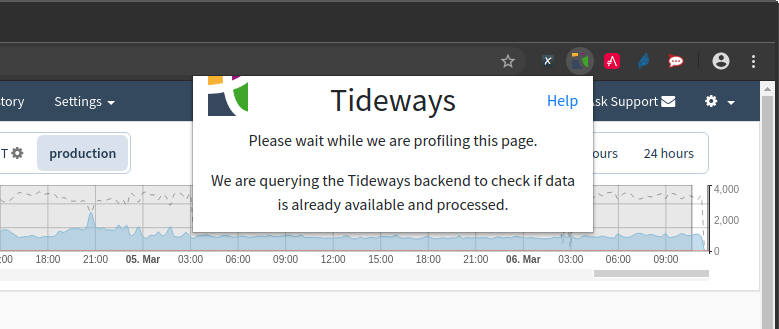
To profile an application, click the "Take Profile" button on the right of the application’s name that you want to profile. Once clicked, the current page will automatically reload and a full timeline & callgraph trace will be collected for the current page. The timeline and callgraph trace include all AJAX requests that get triggered immediately after the page reload.
The dialog will change to let you know that the page is being profiled.
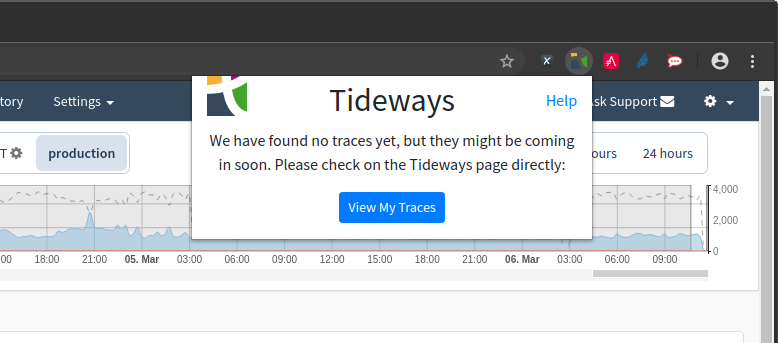
Depending on your application, you may then see the dialog change again to say that no traces have yet been found, as in the screenshot below. This dialog gives you the option to view the traces for your application by clicking View My Traces button. Alternatively, you will be able to select on of the collected traces for your application which you want to investigate. You can do so by clicking the link in the bottom of the dialog.
When on the Traces page, you will see details of the traces that have been collected. You can see:
-
The Amount of memory used
-
The environment and service
-
The duration
-
The starting amount of memory
-
How the memory changed
-
The URL
-
The host
-
The HTTP method; and
-
The request status
You can also see the CPU percentage, used memory percentage, and load average, plus a lot more detailed information.
| You can find out more about this in the Timeline Profiler, and the Callgraph Profiler. |
Profiling More Complex Interactions
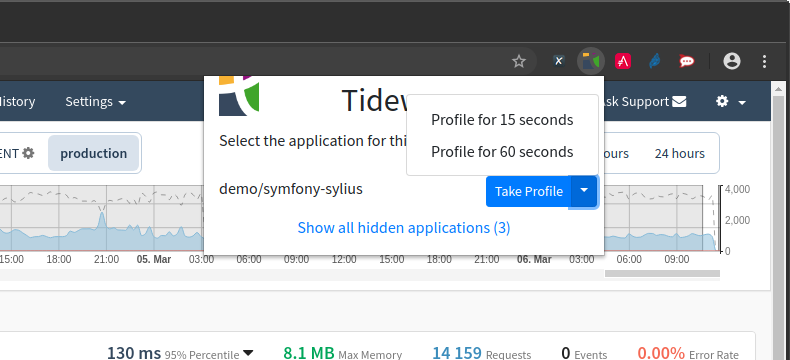
If you want to take profiles from more complex interactions such as form submissions or Ajax calls that happen as part of an interaction with an application, then click the down arrow next to the "Take Profile" button and select the Profile for 15 seconds or Profile for 60 seconds options.
These will start tracing for 15 and 60 seconds respectively, giving you enough time to trigger any form, POST, or Ajax request that you want to profile. When choosing one of these options, the popup will close and you will see a countdown appear on top of the Tideways extension icon.
In Conclusion
And that’s how to generate traces with Tideways using the Tideway’s Google Chrome extension.