The Server Timings API
| New in version 5.2.4 |
| Please ensure that you’re using a browser version which supports the server timings API. |
The PHP extension supports the Server Timings API which:
The Server-Timing header communicates one or more metrics and descriptions for a given request-response cycle. It is used to surface any backend server timing metrics (e.g. database read/write, CPU time, file system access, etc.) in the developer tools in the user’s browser or in the PerformanceServerTiming interface.
— Server-Timing
MDN Web Docs
MDN Web Docs
When instrumented, a request’s timespans and their timing information will be available.
To enable the Server Timing API for a request, you need to transform the performance data Tideways collected into the right Server-Timing header format, by calling \Tideways\Profiler::generateServerTimingHeaderValue().
Usage Examples
Here are two examples of how to use it in your applications.
In Pure PHP
<?php

header("Server-Timing: " . \Tideways\Profiler::generateServerTimingHeaderValue());
When Using the Symfony Framework
<?php

//...existing code

$response->headers->add(
    [
        'Server-Timing' => Tideways\Profiler::generateServerTimingHeaderValue()
    ]
);
When Using the Mezzio Framework
src/Your_Module/src/Middleware/Tideways/ServerTimingMiddleware.php
<?php

declare(strict_types=1);

namespace App\Middleware\Tideways;

use Psr\Http\Message\ResponseInterface;
use Psr\Http\Message\ServerRequestInterface;
use Psr\Http\Server\MiddlewareInterface;
use Psr\Http\Server\RequestHandlerInterface;
use Tideways\Profiler;

class ServerTimingMiddleware implements MiddlewareInterface
{
    public function process(
        ServerRequestInterface $request,
        RequestHandlerInterface $handler
    ): ResponseInterface
    {
        $response = $handler->handle($request);
        return $response->withHeader(
            'Server-Timing',
            Profiler::generateServerTimingHeaderValue()
        );
    }
}
Viewing Server Timing Information
To view Server Timing information, open the Developer Tools in Firefox, Chrome, or Chromium, then:
-
Open the Developer Tools
-
Open the Network tab
-
Click on the URL of the request; and then
-
In Firefox: click the Timings tab
-
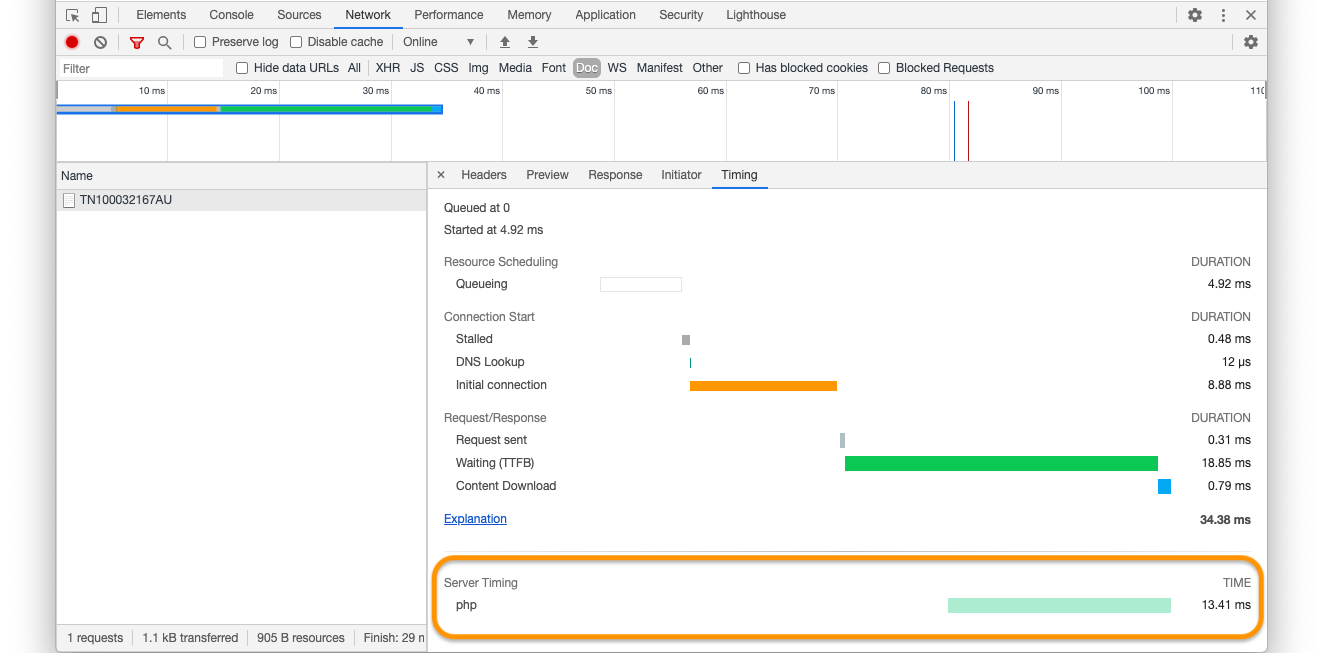
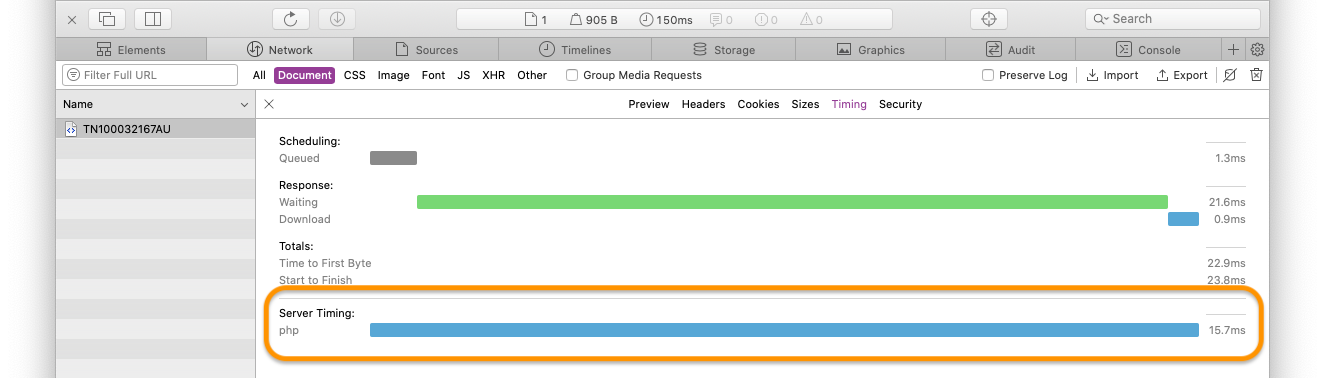
In Chrome, Chromium, and Safari: click the Timing tab
-
In Firefox
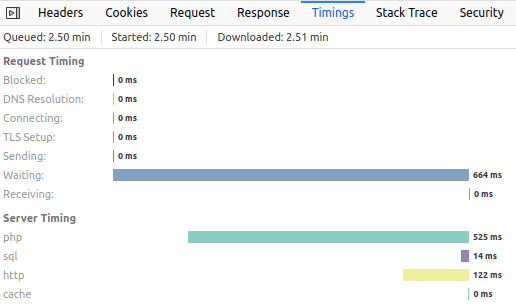
Figure 1. Viewing Server Timing information in the Timings tab of Firefox’s Developer Tools
Still need help?
Email [email protected]