Adding Markers to Charts
To reference certain important events in the lifecycle in a project, named markers can be added to charts. A marker will show the performance before and after its selected date, which allows a quick comparison if necessary.
Examples for using marker events are "Start of E-Mail Marketing Campaign or TV campaign", changing important configuration of the servers, start of an unexplained performance change.
To compare the performance before and after releases, the Release Tracking feature should be used instead of Markers, because it can be integrated with automated notifications which the markers do not support.
Add Marker from the User Interface
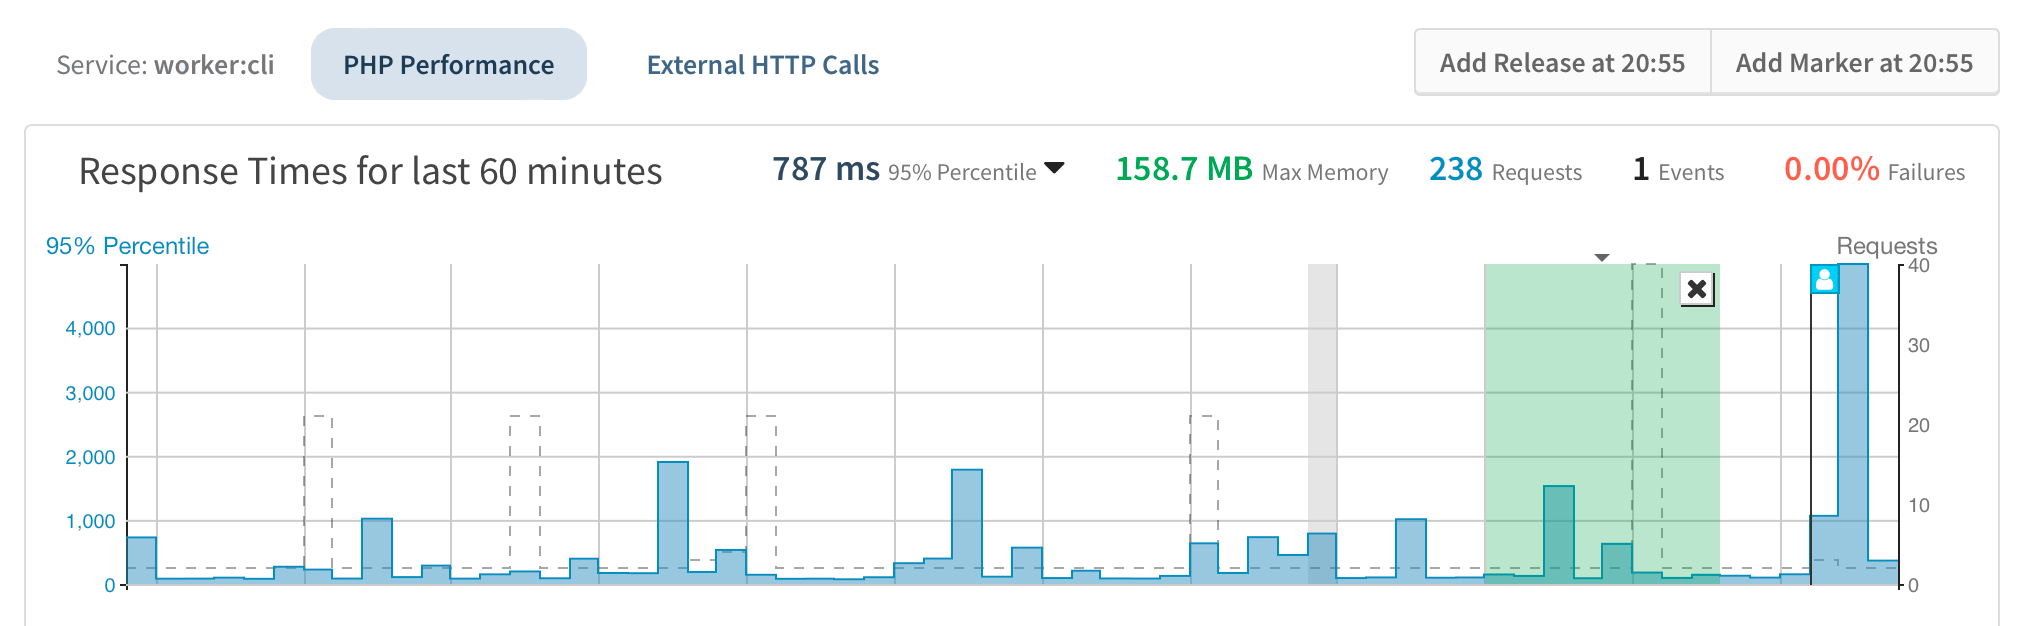
Adding a marker can be done from the performance overview screen of a service by clicking on the minute you want to mark. The snapshot view opens including the "Add Marker" button located on the right side of these screens as shown in the following screenshot.
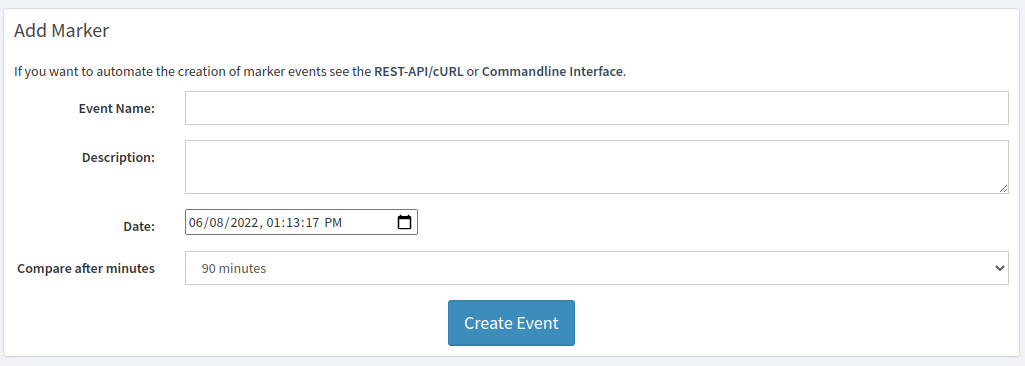
The "Add Marker" form allows to provide a name, description and the exact time the marker should reference. A marker is scoped by the currently selected service and environment automatically.
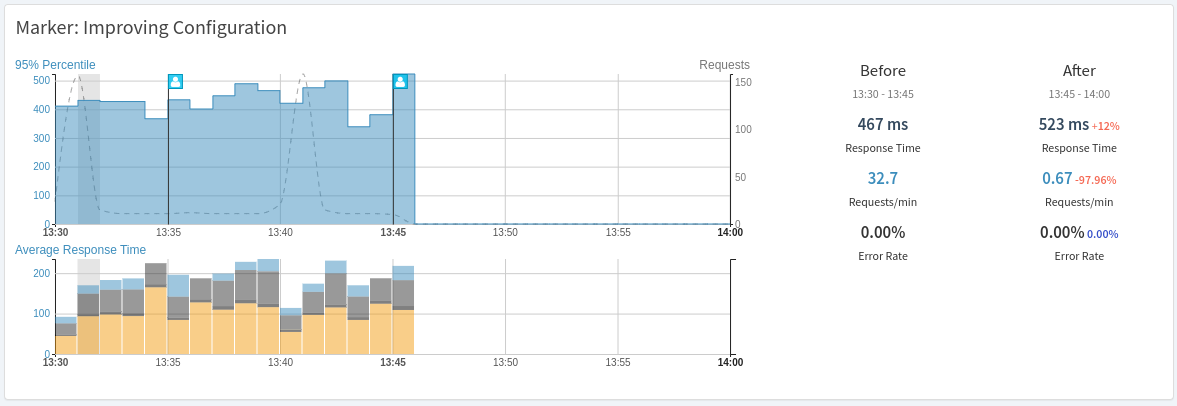
The marker details include the overall performance before and after and highlight the most improved and degraded transactions. This is similar to the release comparisons with the difference that no notifications will be sent for markers.
For each transaction, you can directly find the root cause of the performance changes by comparing all available traces before and after the marker using trace aggregation.