Slow SQL Query Logging
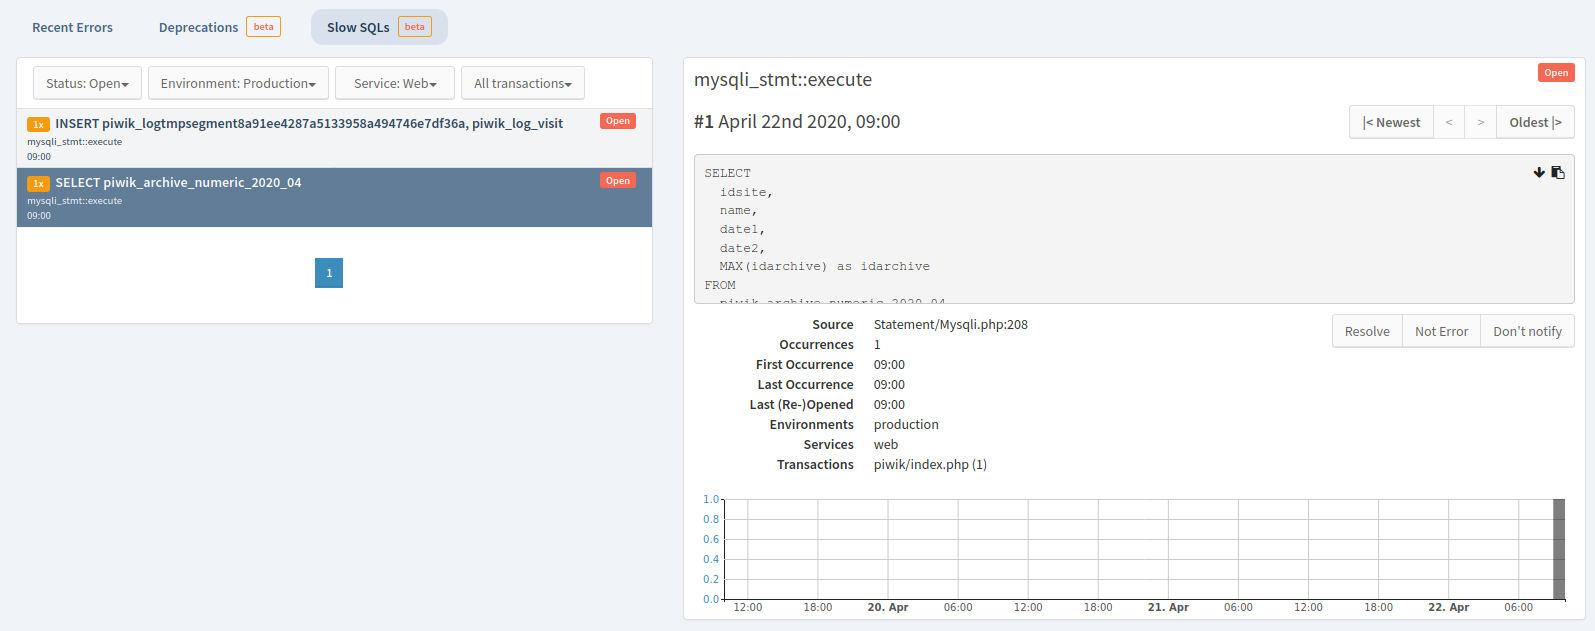
The Slow SQL Log feature in Tideways is similar to MySQL’s, and other databases, slow query logfiles, but extended by application context information such as Stacktrace, which URL and transaction the query occurred on and others. In addition Slow SQL queries are grouped by similarity, so that you don’t get notified about the same Slow SQL over and over again.
By default the slow SQL logging is configured on the extension level to track queries that are slower than 1000ms (1 second).
You can lower the threshold to minimum values defined by the plan of the organization/project:
| Plan | Minimal Threshold |
|---|---|
Pro |
100 ms |
Standard |
100 ms |
Basic |
250 ms |
Request-Based |
1s |
Lite (Legacy) |
Not available |
Hosting Lite (Legacy) |
Not available |
To change the slow SQL logging threshold to your need, reduce the INI setting from its default of 1 seconds to a lower value:
tideways.sql_long_query_time_ms=250The example above means that every query slower than 250ms is considered a slow query and appears in the slow query log.
| Currently, slow SQL queries do not trigger notifications configured for the "New Error/Exception" notification type. However, you can configure notifications to be sent when a Slow SQL query occurs. |