Slow SQL Query Log
Overview
One major source of performance bottlenecks in PHP applications are slow SQL queries. These can happen for a variety of reasons, including not using indexes, using the wrong index(es), and using temporary tables. That’s why the Tideways UI includes a Slow SQL Query Log.
The Slow SQL Query Log is, effectively, a classic database slow query log, but which also provides application context. This additional context helps you quickly identify and fix faulty SQL queries. The slow SQL queries are aggregated based on the "Summary Statement", which is the statement’s type (INSERT, SELECT, DELETE, etc), plus the tables which formed the query; such as when the query involves the use of one or more joins.
The Slow SQL Query Log uses the same UI and workflows that Errors and Exceptions do, and both are now grouped under a new main navigation item, called "Issues". What’s more, you can configure alerts to be sent when slow SQL queries are detected in your application.
Accessing the Slow SQL Query Log
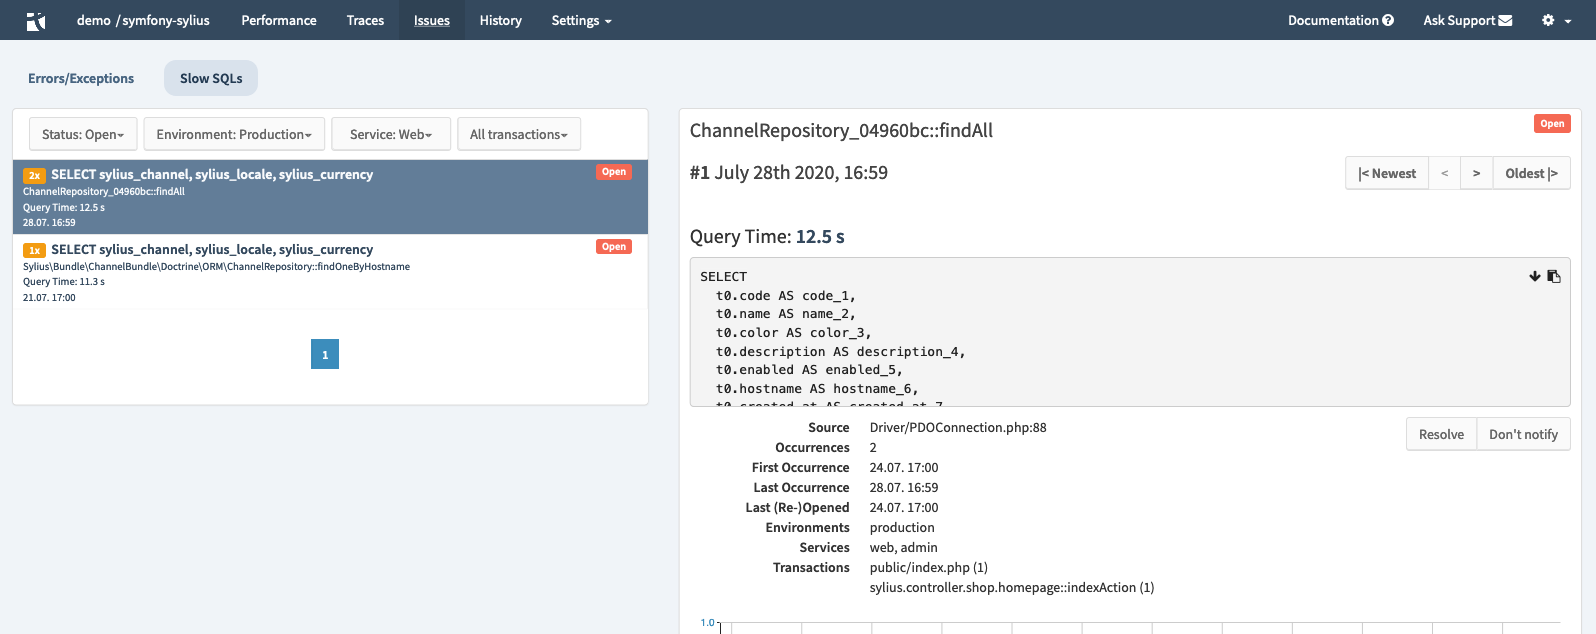
To access the Slow SQL Query Log, navigate to . There, on the left, you will see a list of all of the captured slow queries.
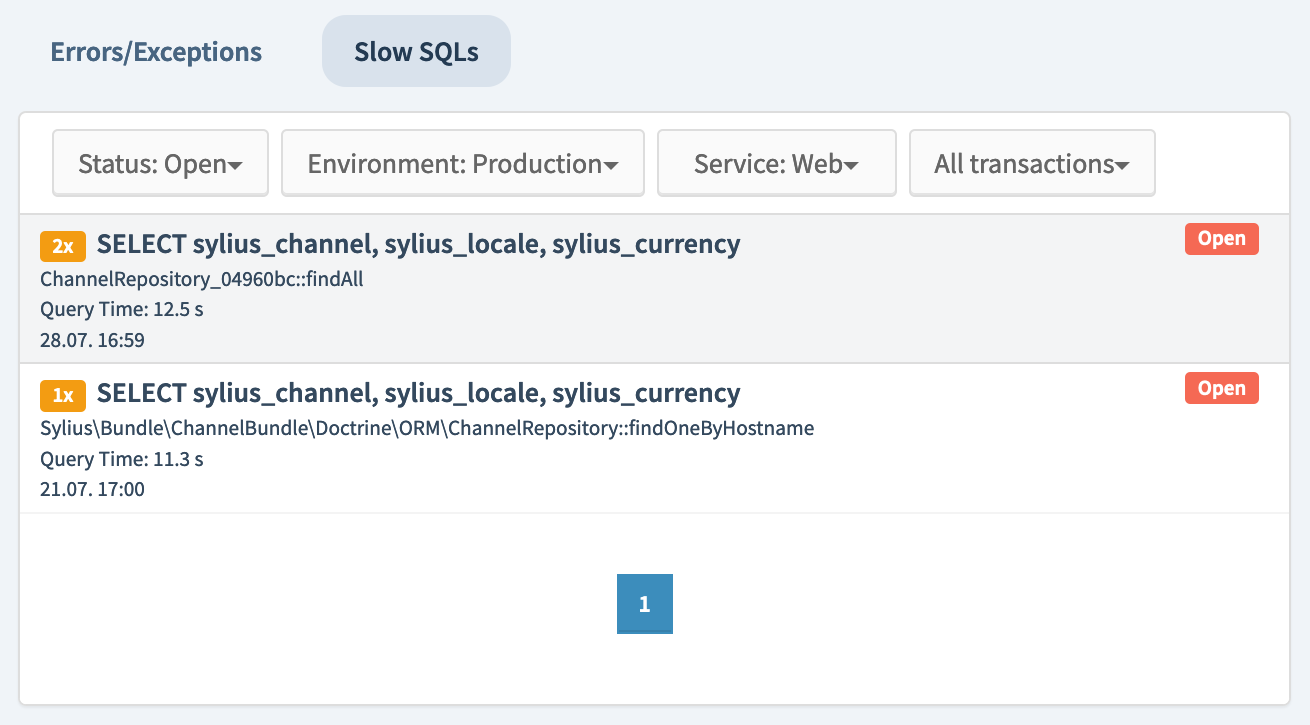
For each one, you will see
-
The number of occurrences since the previous release
-
The SQL query
-
The controller and function which called the query
-
The query duration
-
The timestamp when the query was called
-
The query status
If there is at least one slow query, the first (top-most) query will be selected, and its details will be visible in the right-hand side, error details, panel. In that panel, the following information will be available:
-
The error’s details. This includes the environment(s), service(s), first occurrence, last occurrence, and transactions. In this panel, you can navigate through each of the occurrences of the query, as well as apply a resolution status (Resolve, Not Error, Mute)
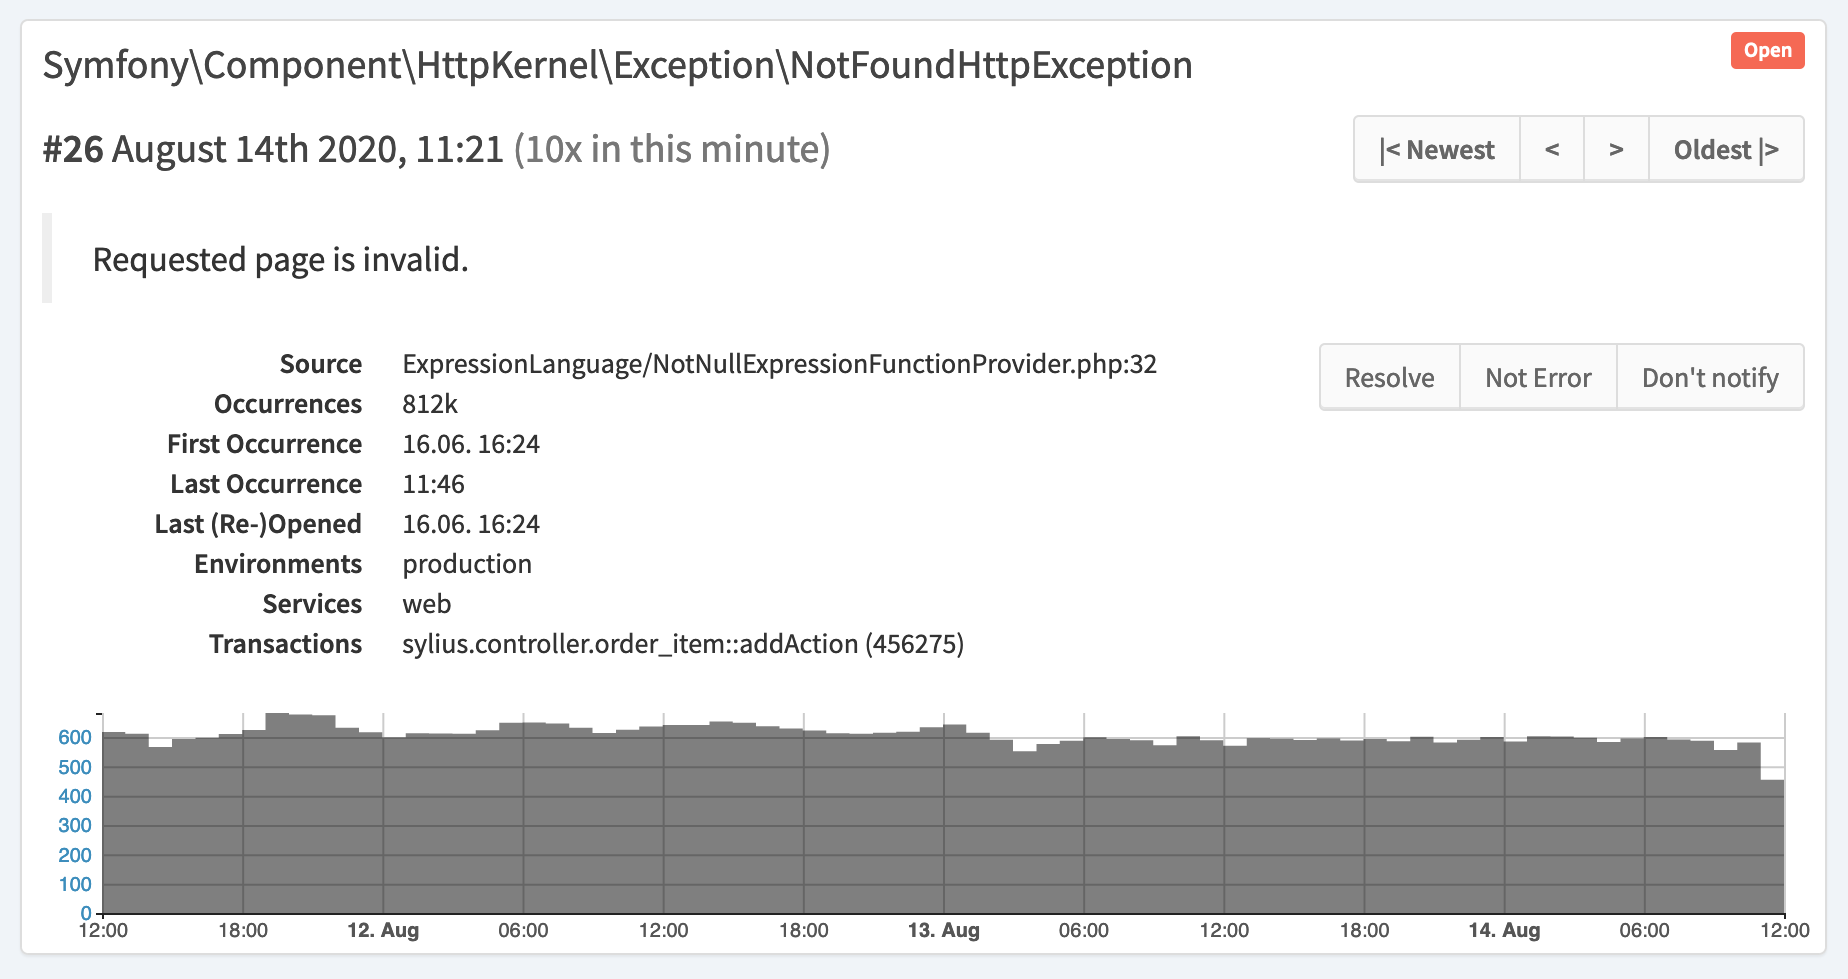 Figure 3. A slow SQL query’s error details
 -
The application stacktrace at the time of the slow SQL query
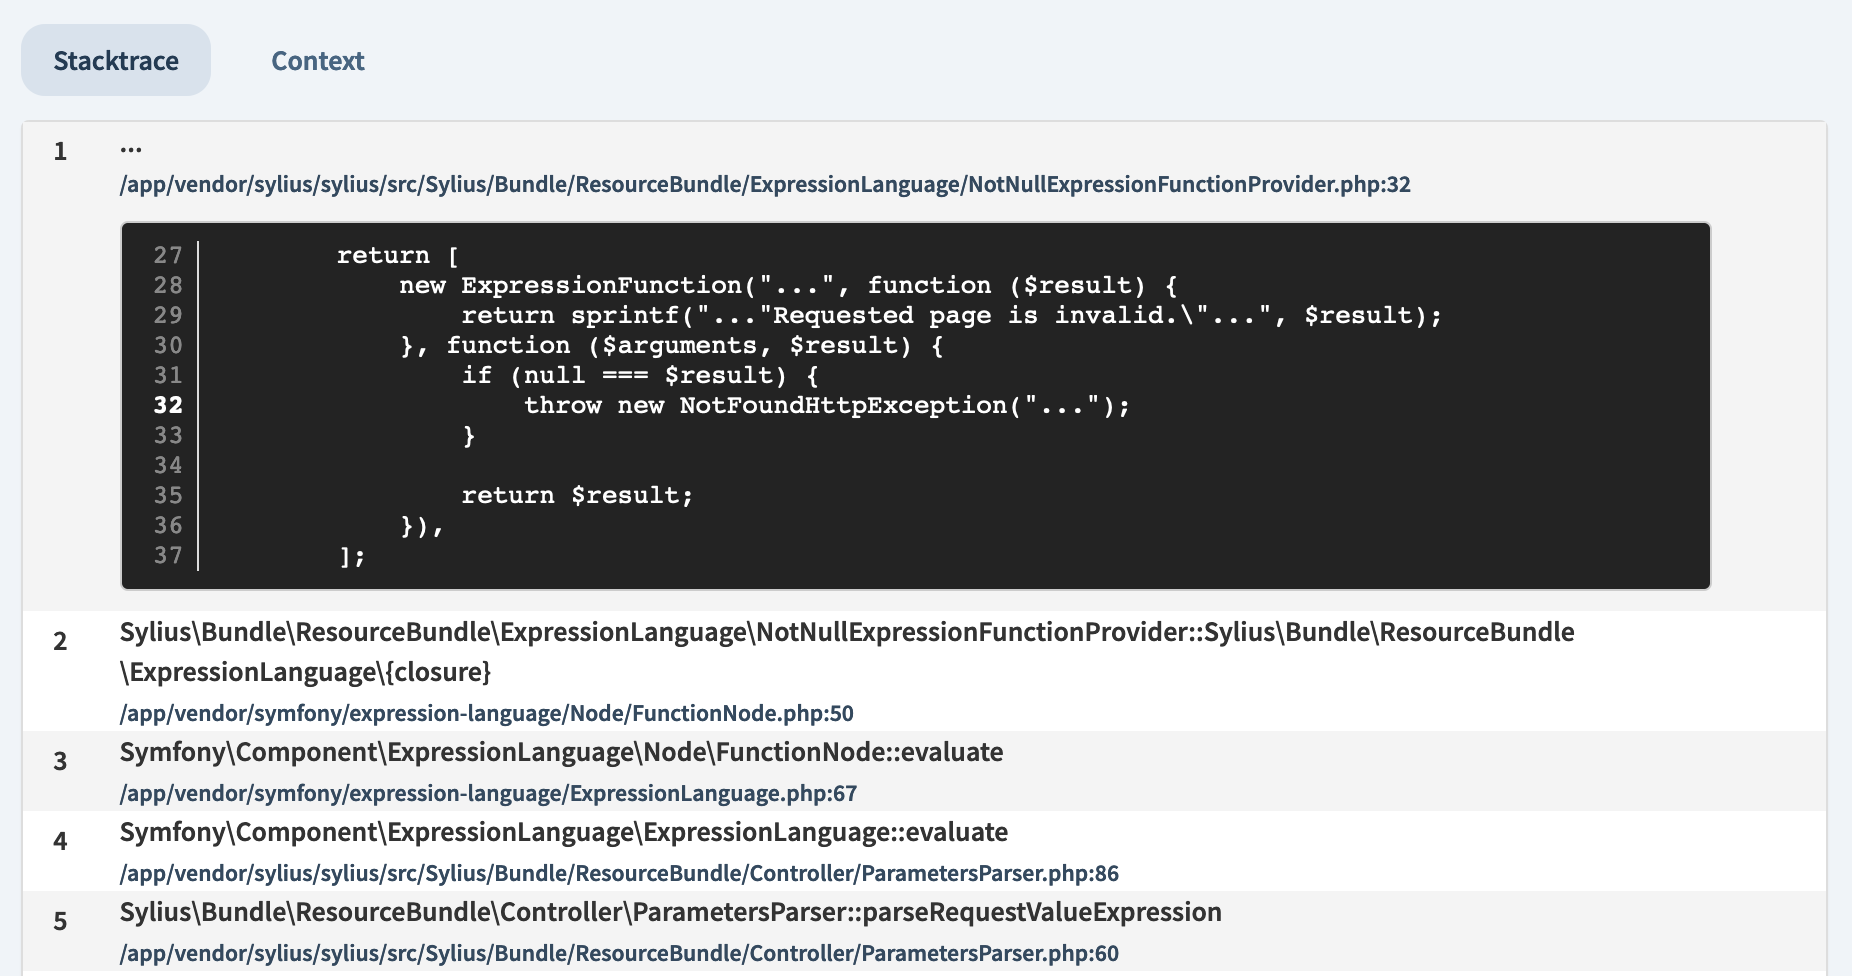 Figure 4. The application’s stacktrace
 -
The application context at the time of the slow SQL query This includes the host, method, status, url, PHP SAPI and calling script
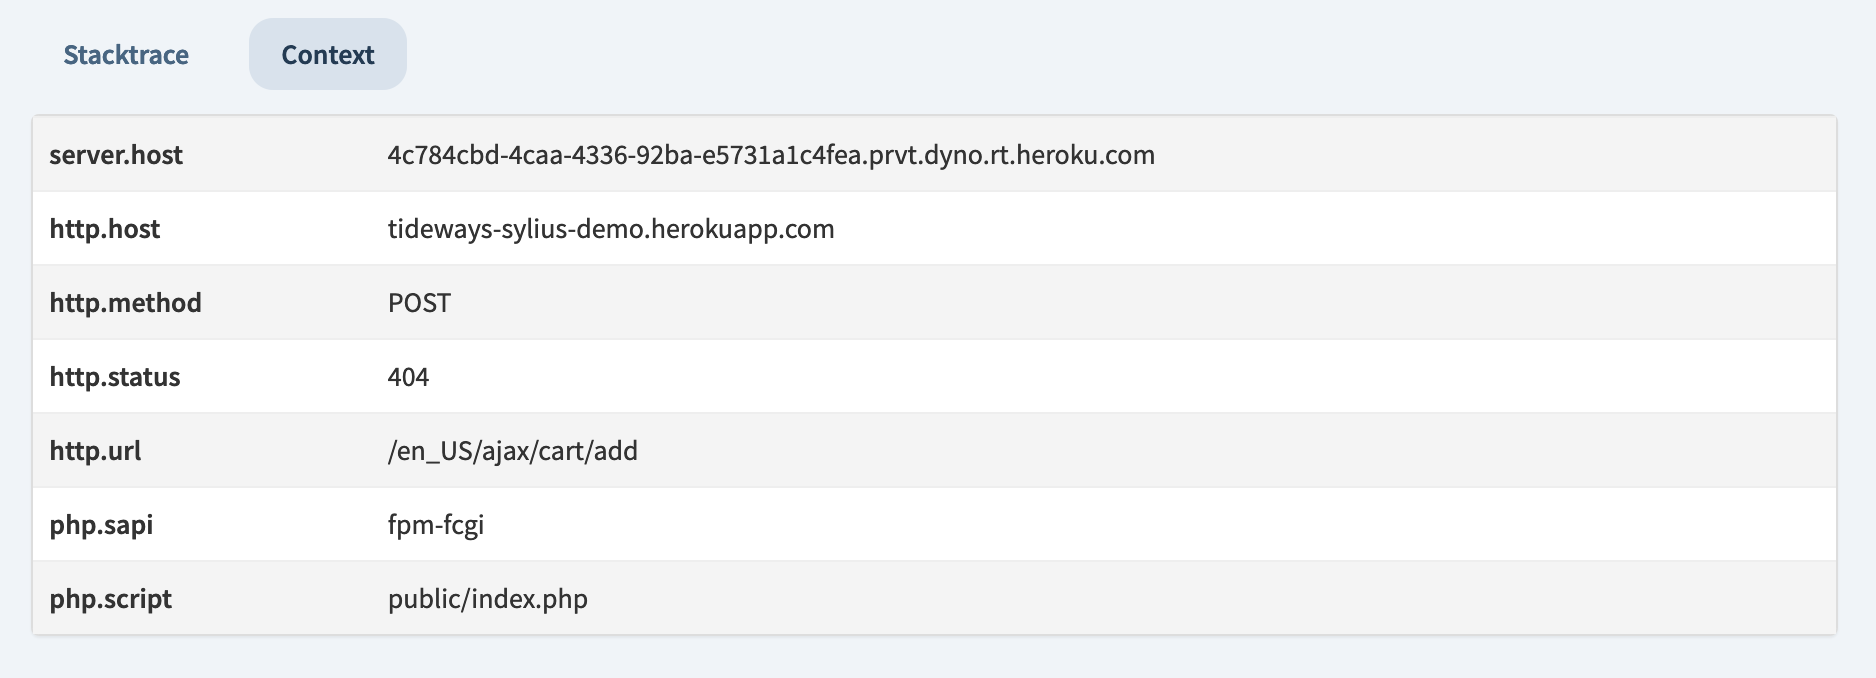 Figure 5. The application’s context