Tracepoints
With tracepoints you can get more control over the trace sampling that Tideways uses to filter up to your traces / minute license limit. This allows you to collect a lot more traces of the parts in your project that you are currently interested in.
Examples of Tracepoint rules that you could run on your project include:
-
Keeping all traces of a specific URL that is slow
-
Keeping all error traces with an HTTP 500 status code on a specific endpoint
-
Keeping all traces of a customer’s subdomain, "customer.myproduct.com"
Select a transactions and optionally add more filter criteria based on the request, and Tideways will keep traces matching the Tracepoint criteria with higher preference.
You can even enable callgraph profiling through a tracepoint.
The following video gives a short introduction to Tracepoints and how they work:
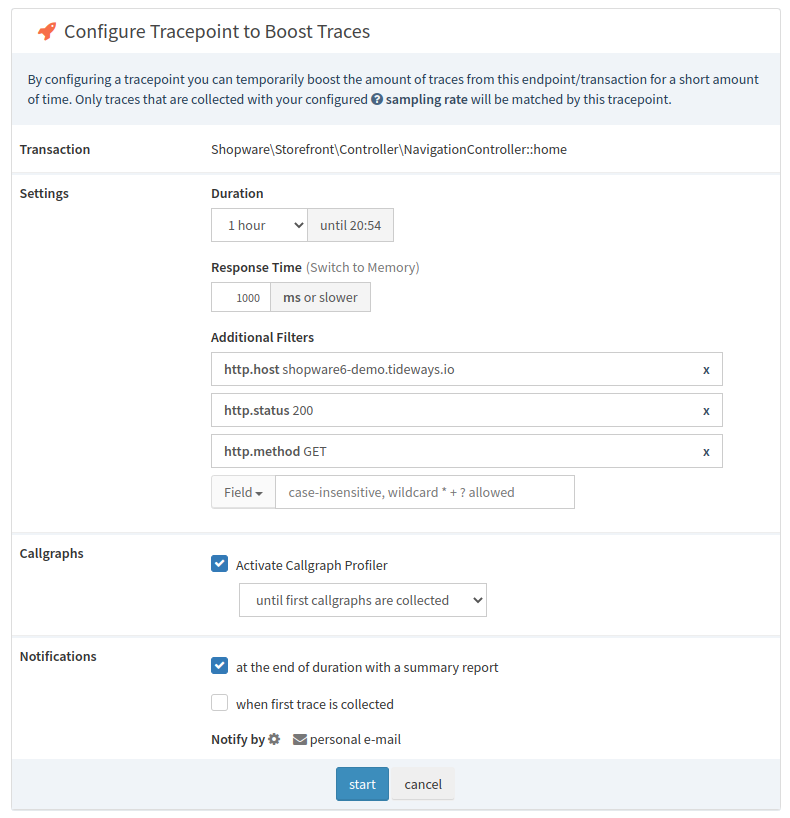
Setting a Tracepoint with Additional Filters
To use Tracepoints, drill down into a transaction of your project, then click Boost Traces. Then, fill out and submit the "Configure Tracepoint to Boost Traces" form with your filter criteria and notification preferences.
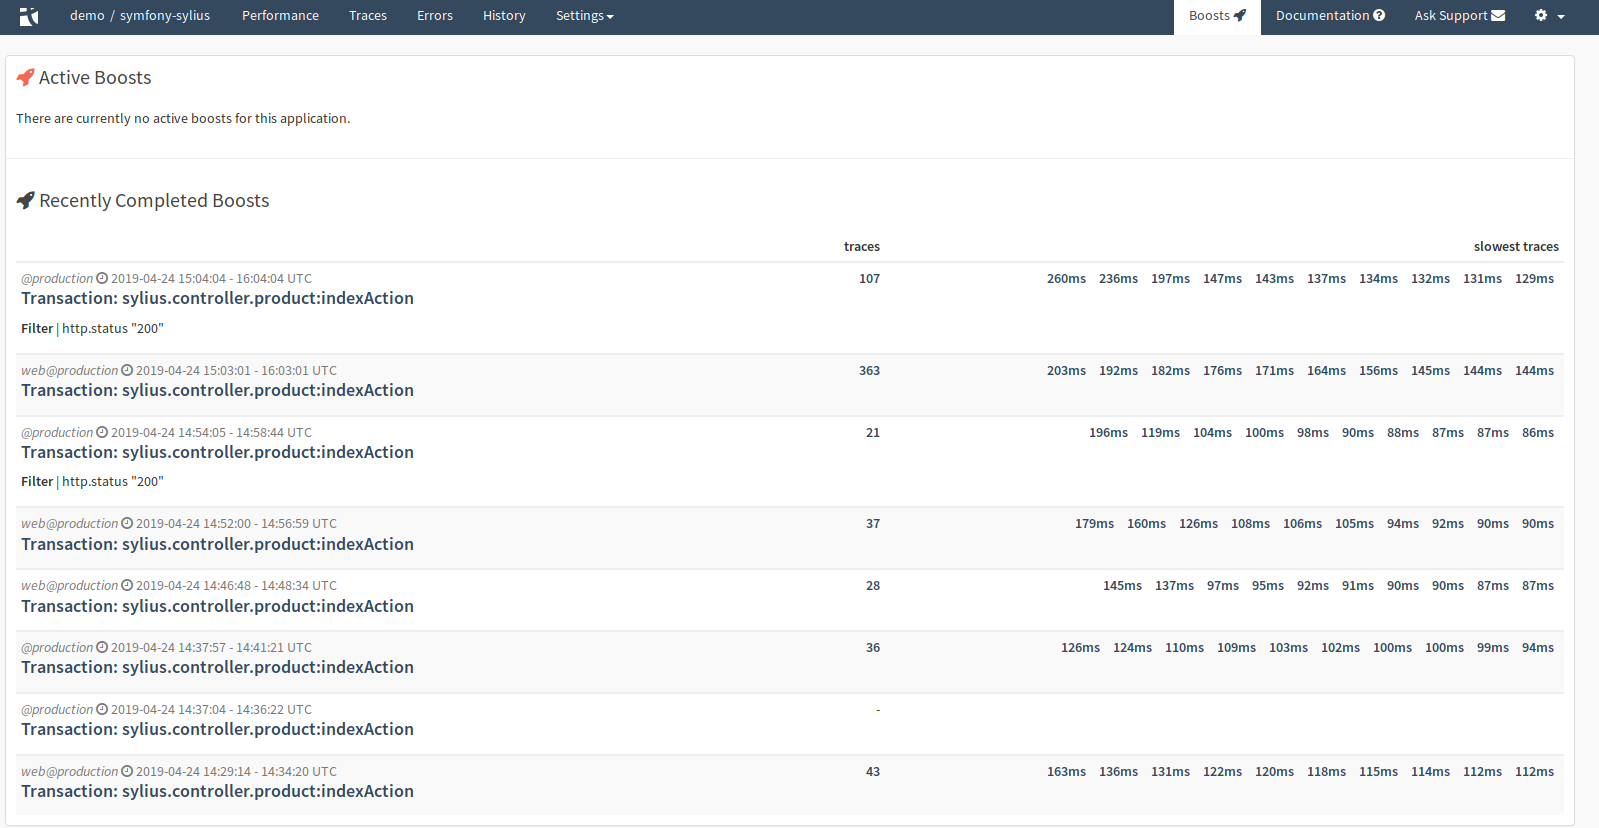
Click the Traces entry in the main navigation on top to see a list of all active and recently completed traces of your project:
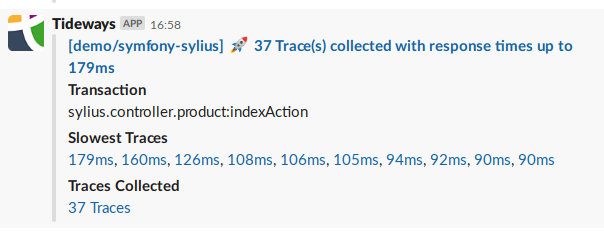
You can also send notification summaries via email or Slack, when a trace is completed, so that you can immediately dive into the data:
Automatic Tracepoints
With automatic tracepoints, Tideways creates tracepoints with callgraph profiling for you on a configured schedule.
You can configure these automatic tracepoints triggers yourself, and there is one created for the web context of every service for you.
For plans with long-term trace storage in the history, these traces with callgraphs are kept with a higher priority as they provide more in insights.
The "Tracepoints" module lists the most recently triggered traces of every automatic tracepoint trigger.
Tracepoints and Partial Callgraphs Explained
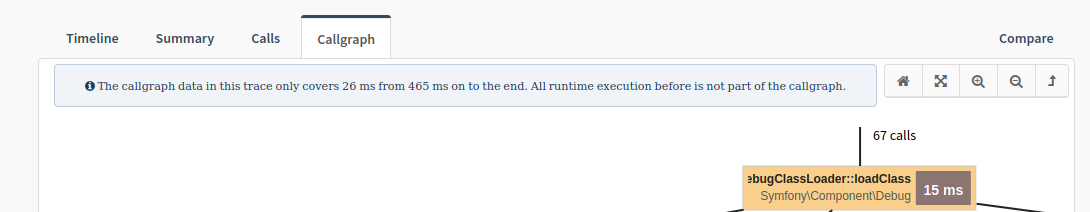
When you trigger a callgraph with a tracepoint, callgraph data will only be collected from when the code first detected the transaction with an active callgraph tracepoint.
Depending on your code and framework this usually happens a few milliseconds into the request, not immediately at the beginning, after the request was matched to a controller by the routing component.
This creates a partial callgraph and there is a notification in the user interface when you look at a partial callgraph. Functions that are called before the callgraph profiler was activated will not be part of this partial callgraph.
You can see exactly when the partial callgraph is started in the timeline view of a trace, where we show a horizontal line for the "tracepoint-start" event.