Timeline Profiler
Tideways traces are displayed in a timeline starting from the beginning of a request until the end. The profiler collects interesting operations such as SQL statements, controller calls, or rendering of templates, and places them onto the timeline view. Each individual operation is represented by a timespan.
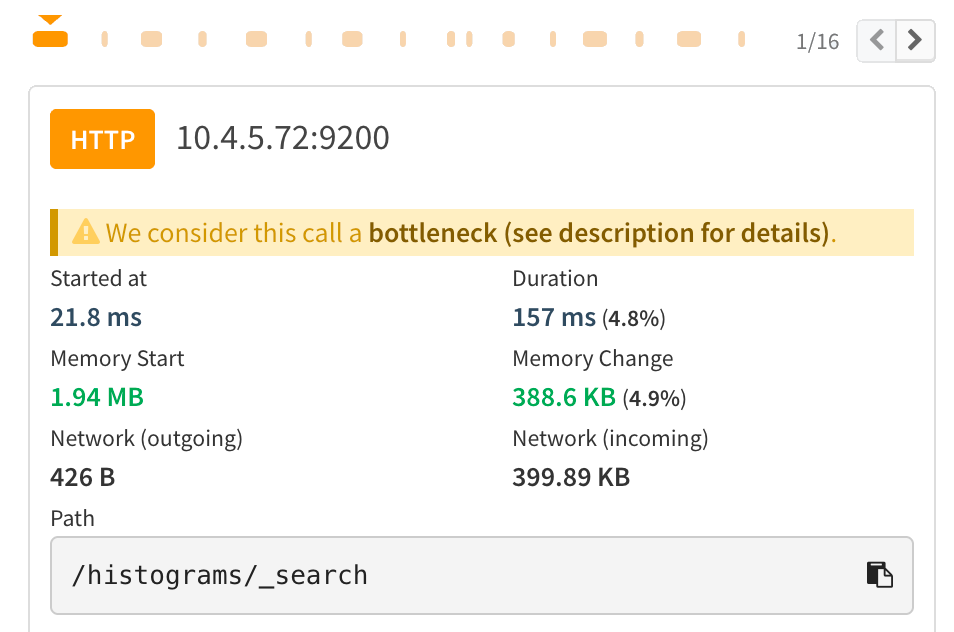
You can click on each individual timespan to see details about it. For SQL statements, Tideways collects anonymized queries, and for templates it collects the template name, for HTTP calls the host, url and response codes. Spans that took longer than a configured threshold also include the PHP backtrace. You can toggle between the response time (latency) and the memory timeline views.
Stacktraces on Spans
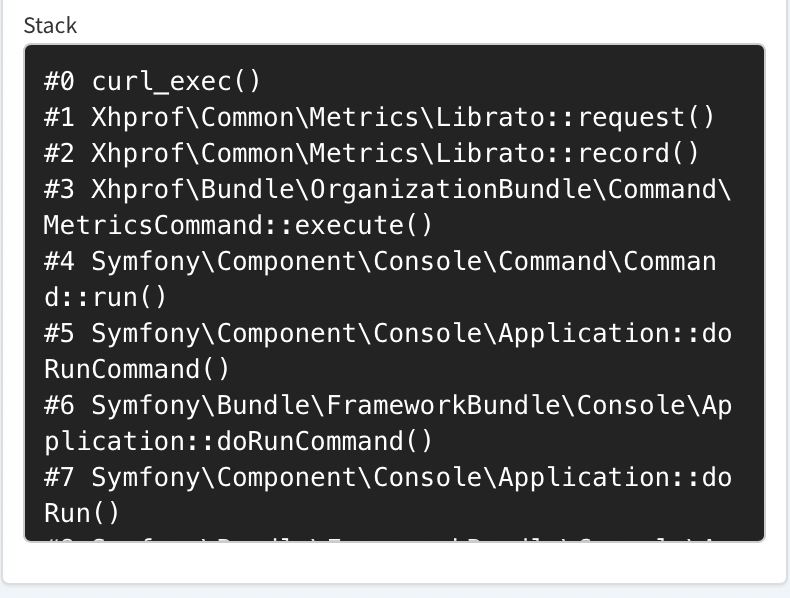
When viewing a timespan it may show the stacktrace of functions that lead to
its collection. For example all function calls leading up to an HTTP request
with curl_exec.
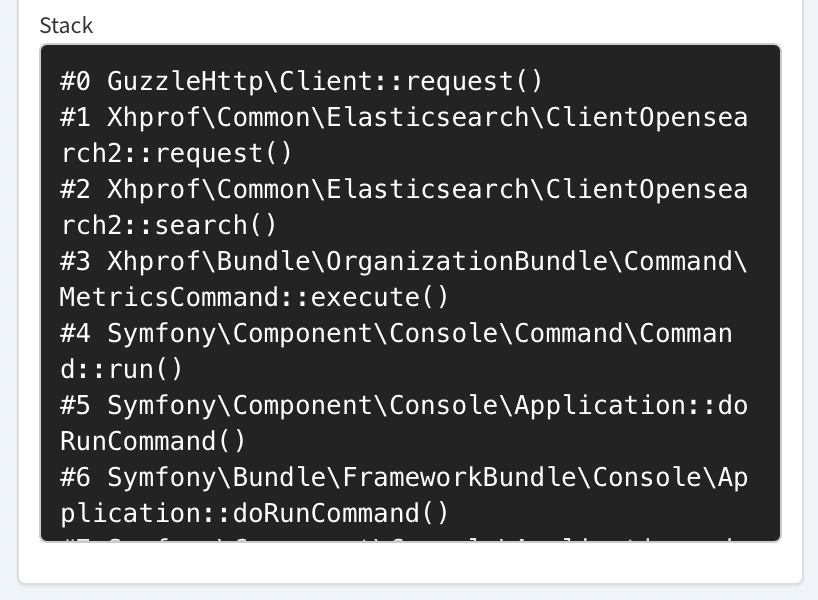
For some vendor libraries such as Guzzle, Doctrine and more, Tideways will cut the stacktrace at the vendor boundary and will store the internal frames of the library or framework that ultimately lead to the span’s collection. This ensures that you see frames from your application code to identify where the span originated in your code-base.
By default spans that run for 3ms or longer are eligible for collection of the stacktrace. The stacktrace will include 5-10 frames depending on the duration of the span.
There are limits to the number of stacktraces and total frames that a trace can contain, which depend on the organization and project plan.
Layout Modes
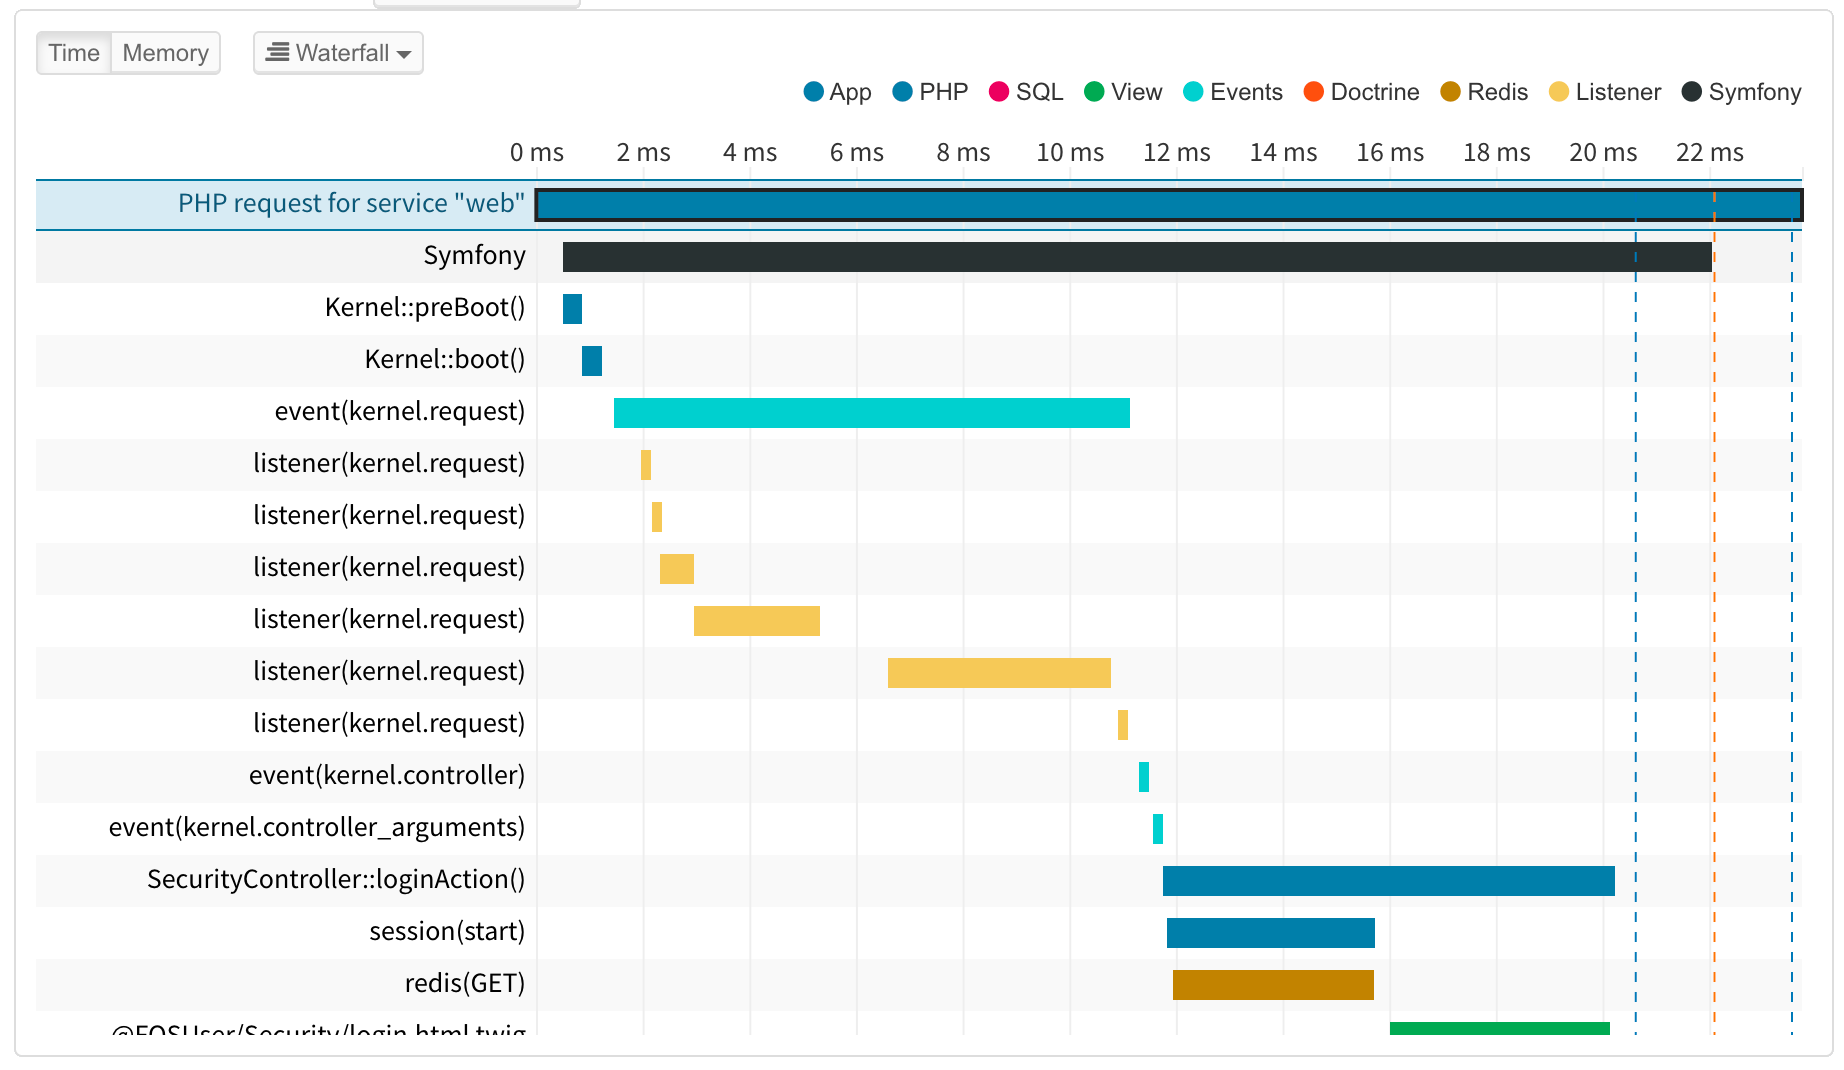
The timeline offers three layout modes to balance compactness with chronological clarity. Use the layout selector in the timeline toolbar to switch between modes; the preference is saved in the browser.
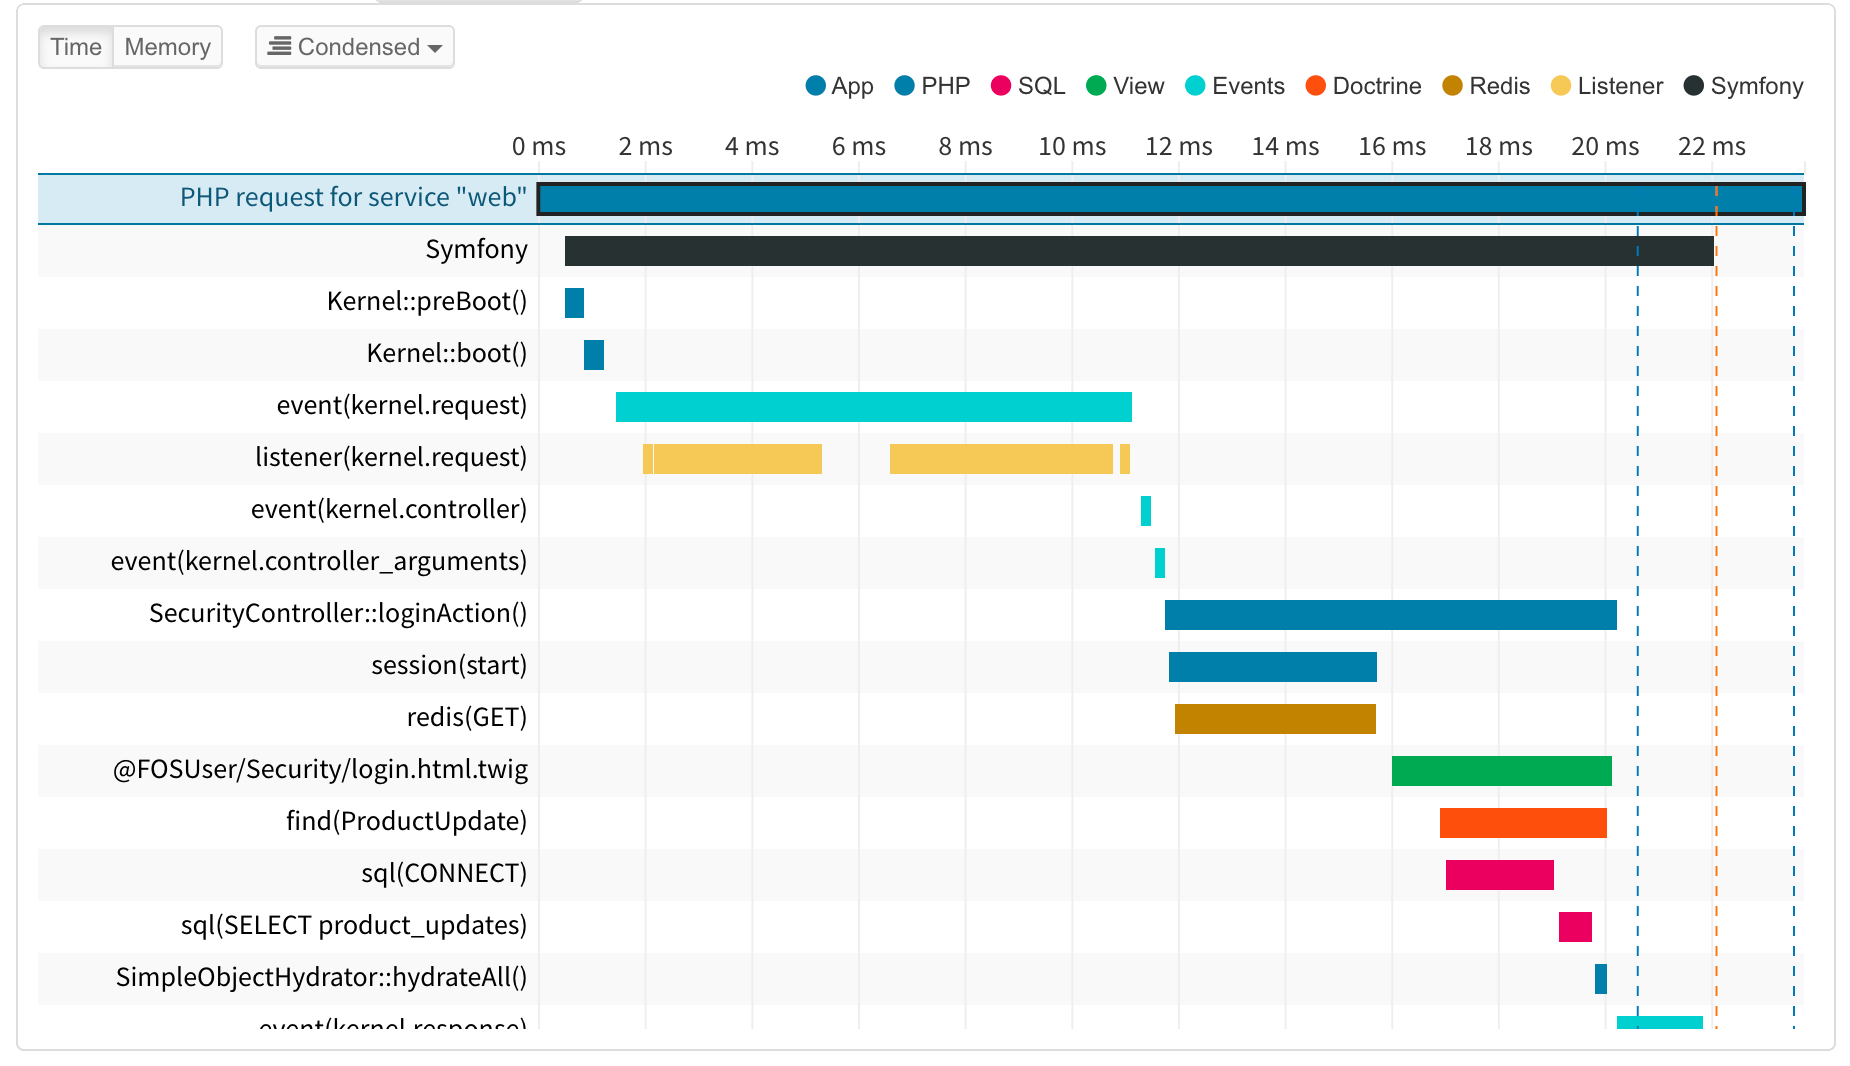
Condensed (Default)
Condensed mode reuses rows within a defined time threshold and always places parent spans above their children. This improves visibility of execution dependencies and chronological order while keeping the view compact.
Span Navigation
When a span type appears multiple times in a trace, the span detail panel provides tools for navigating between occurrences:
-
Summary box: Shows the total count and combined duration across all occurrences.
-
Pagination: Left and right arrows let you jump between each occurrence in the timeline.
-
Mini-Timeline: A compact visualization showing the relative position and duration of every occurrence, with clickable navigation.
This navigation is also available in the Summary and Flame Graph tabs.
Row Selection
Clicking anywhere on a row in the timeline highlights the full row and selects that span. Clicking directly on a row’s summary label text selects the first matching span in the trace automatically.