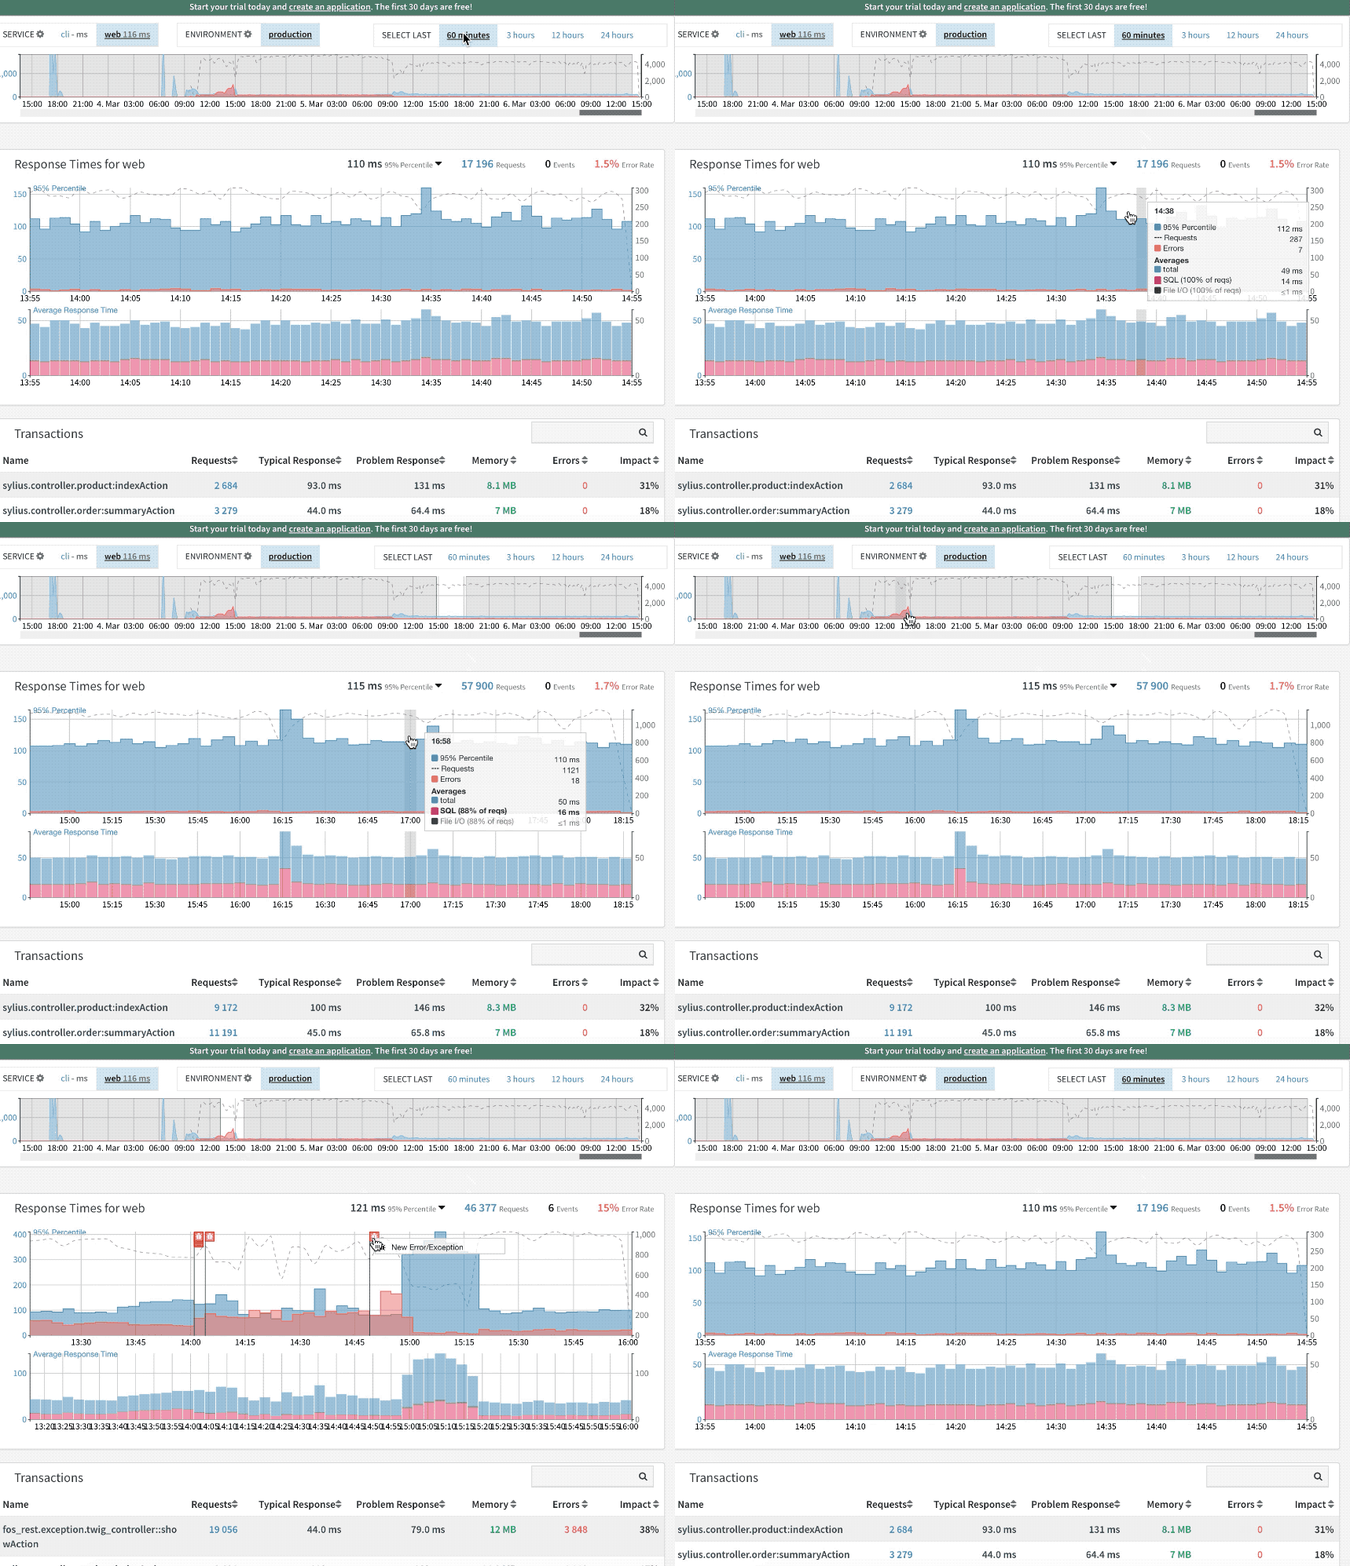
Application Performance Overview
Tideways is a single tool for profiling, monitoring, and tracking exceptions in PHP applications.

The Project Performance Overview shows your application’s performance with response times measured in 95% percentiles.
Hovering over each minute, you can see the exact response-time and the number of requests that were measured.
Blue bars represent the response time, with the y-axis on the left of the chart. Red bars represent the number of failures. And the dashed grey line represents the number of requests, with the y-axis on the right side of the chart. The main performance screen also shows the aggregated 95% response time, number of requests and failure rate of the currently selected time period.
Failures are requests that ended with:
-
an uncaught exception leading to a PHP Fatal Error
-
an exception caught at the highest framework level
-
a HTTP status code great or equal than 500
-
a response time that was slower than the users configured response time target
Below the main response time chart is a smaller chart that shows downstream layer performance from SQL, HTTP, Redis, Memcache, MongoDB, and other supported databases. If you hover over the graph with the mouse, you will see the exact response times and request count, errors, and averages for the selected time.
When you over over a bar a tooltip will show the response time, requests, failure rate and downstream layer performance at the highlighted point in time. The tooltip also shows a breakdown of the HTTP status codes for all requests.
The graph with response times is the entry point to every project. You can select different periods to look at with the time-selector. By default, we show the last 60 minutes, but other durations are available as well: 3 hours, 12 hours, 24 hours.
To view the performance at different points in time, you can select different periods via drag-and-drop in the time explorer at the top of the screen, or switch between services (like CLI, Web, Admin or anything you want to group by) and environments (like Production, Staging, Testing).
Special events such as new exceptions, new releases or alert triggers are displayed as horizontal lines with flags in the chart. You can click them to get more details about what was happening in your project.