Transaction Detail View
When selecting a transaction to view, you will see detailed performance minute by minute information about this transaction. From here, you can also navigate to individual traces that Tideways collected for the transaction, at the bottom of the screen.
Directly below the main response time chart is a smaller chart that shows downstream layer performance. SQL, External HTTP, Redis, Memcache, MongoDB and other supported databases. This is only available on non-legacy plans or Tideways 5 (Legacy) Pro.
Response Time Distribution
The transaction details screen includes a histogram that shows the distribution of all response times, by putting them into buckets. The largest bar in the histogram is the response time interval, with the most requests ending between the interval’s begin and end response time. If you hover over a bar, it will show you exactly how many requests happened and what the exact interval is.
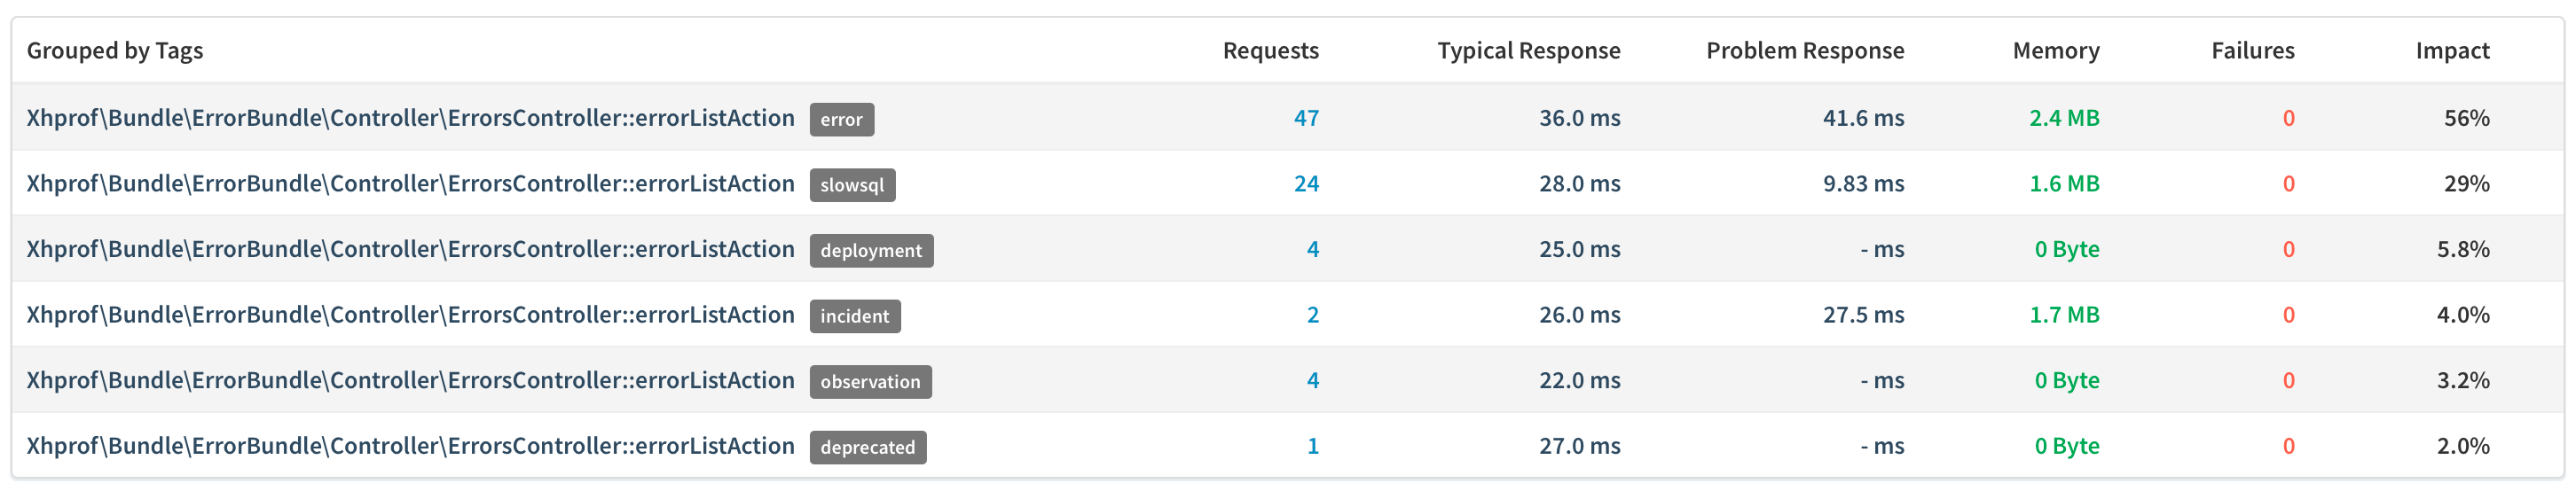
Performance segmented by Tags
| This feature is only available in non-legacy plans introduced in Spring 2023. |
For some transactions a segmentation by additional dimensions can help improve the understanding of performance behavior. Tideways allows to assign up to 3 tags to any request that allow an analysis of transaction performance by tag on the transaction detail screen.
One special case of transaction tags are "cached" and "uncached" that are set by the page cache hit rate API.
Requests with multiple tags are tracked into multiple transactions with each individual tag. Viewing a cross-section of the performance for requests that have multiple tags is not possible.
All transactions with tags are set to "Limited" visibility by default. You need change their visibility to "Full" to get detailed minute-by-minute monitoring data for them.
License Restrictions
-
The "Pro" license includes a breakdown of the performance via layer for each minute, which is not included in "Standard" and "Basic".
-
The "Standard" and "Pro" license include per minute total performance as 95% percentile that is not included in "Basic".
-
The "Standard" and "Pro" license include the response time distribution chart that is not included in "Basic".
-
The "Basic" license only includes a list of traces collected for the transaction, no performance monitoring data.